Enter your text here...
High Probability Price Pattern Profits eBook
Eight lousy seconds.
That’s all you need.
Forget the fact that the 1,700-pound bull is incredibly upset.
Set aside the reality that you have no idea what direction it will buck.
And stop thinking about what will happen if you fall off.
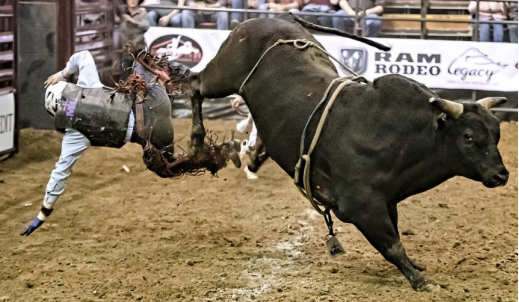
Those are details that someone else can worry about. Welcome to the logic offered in every bar in the world that has a mechanical bull for drunk patrons lining up for a few seconds of pure infamy.
Sound crazy? Well, that’s exactly what millions of traders do the second they saddle up a trade in any futures market of their choice.
With absolutely zero sense of what the market is going to do, or where they should enter or exit -- they throw caution to the wind and make their entry.
What are they hoping for?
An explosive trend or reversal. The kind that you can make your mortgage or Mercedes payment with. The kind that you can repeat over and over without really thinking about it.
And so they make their play. Only to see their account cleared out -- days, sometimes minutes, later. Or equally frustrating… they make their entry only to see the trade go absolutely nowhere… chewing up hours in the process.
If you’ve been trading for any period of time, you know how long it takes for the deep bruises that horrible losses can create to heal. Sure, they might be covered up temporarily by winning streaks.
But it doesn’t take long for a very harsh reality to set in: your plan, your indicator and your results don’t add up to retirement any time soon.
Fortunately, you can take a step towards consistently profitable results. The kind of results that make a full-time income from day trading a reality.
The foundation for these results? You guessed it. Successfully riding these high probability price patterns that take place in every futures market.
Sure, everyone tries to ride these patterns… but most are bucked off with a painful experience and staggering losses.
Why? In most cases they are overcomplicating what should be a very simple trading process.
Chapter One:
What Most Traders Don’t Understand About Explosive Trades
You might be shocked to learn that the primary piece of equipment used isn’t a helmet or gloves. It’s a bull rope.
Setting aside the technical details that go with a bull rope -- its biggest feature is that it’s designed to fall off the bull when he gets that irritating rider off its back.
Why does the rope fall off when the rider lets go? There’s a bell at the bottom. A bell! It gives the rope the weight it needs.
In every market there is a never-ending list of ropes and bells. You’ve got the talking heads. You’ve got historical price action. And of course, you have countless indicators that will supposedly show you the way to market riches.
The result of all of these bells? Confusion. Irritation. Losses.
Look at it this way, if you’re a bull rider -- success can be achieved in 8 seconds.
That’s it. You only need to survive for 8 seconds.
This leads to a critical question for any day trader…
For any given trade, how long does it take you to spot a high probability trend or reversal location? Is it more than 8 seconds? Is it more than 60? A few minutes? Longer?
If you’re lucky the location might surface quickly… but it’s the second-guessing and doubt that chews up the time. And this is despite the best intentions of many traders out there.
Here’s the deal: If you can’t spot and trigger a price action trade in a matter of seconds… then something is wrong with your process.
And the truth of it? Much of what you’re looking at to inform your trade locations is a complete and total waste of time.
That’s right. A total waste of time.
Make no mistake. It’s a well-intentioned, time-honored routine that millions of day traders around the globe do their best to follow. All with the hope of being ready for a big price action move of some kind.
The ‘checklist for success’ that many educators tout for finding day trading opportunities is pretty typical:
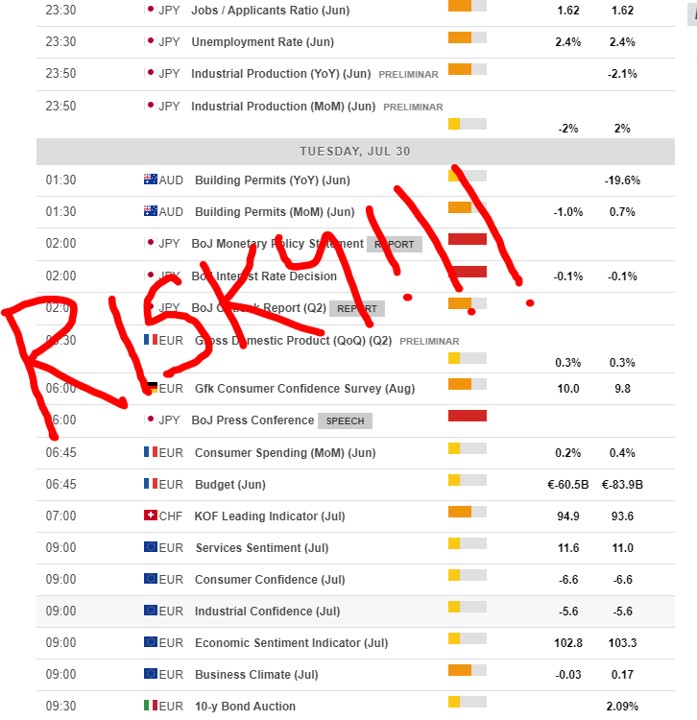
Typical Day Trading Prep Step 1: Figure out if there will be any market-moving events that will cause volatility. Makes enough sense. That’s what economic calendars were made for right? And it’s always loaded with events that are flagged with the color red, indicating massive volatility.
>> Problem: The price action during these events is ENTIRELY UNPREDICTABLE. Timing an entry is very difficult due to this erratic price action and most day traders end up getting their clocks cleaned.
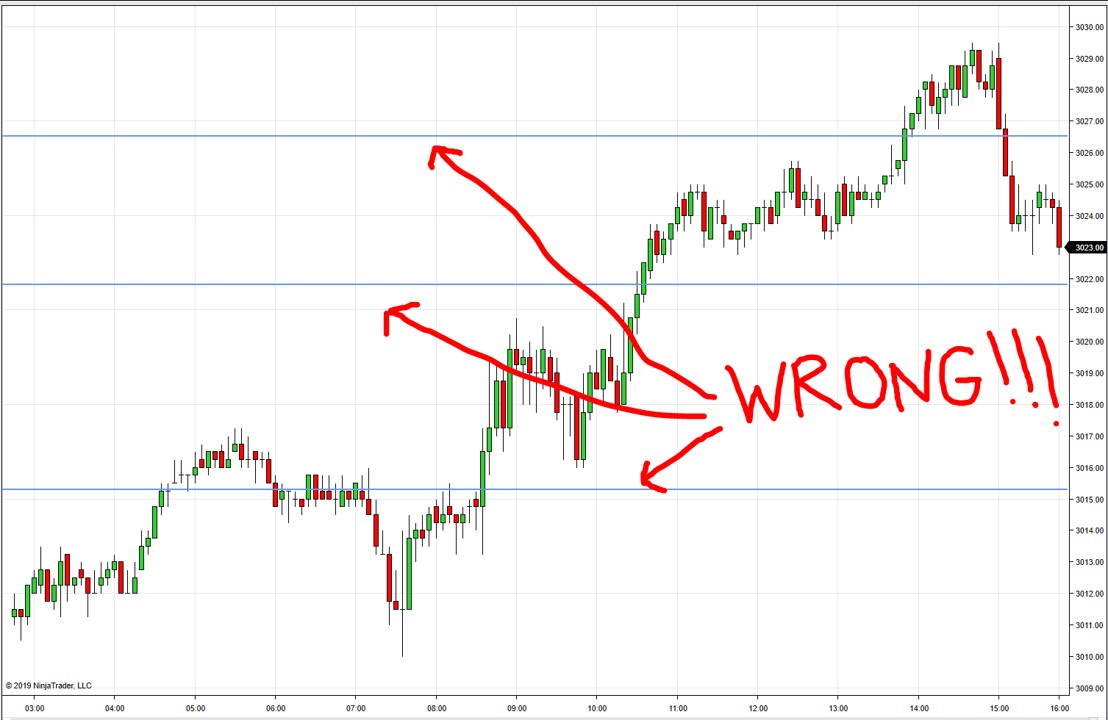
Typical Day Trading Prep Step 2: Establish support and resistance price levels along with any major reversal points. Of course. Everyone has been told that ‘reliable’ market patterns start to emerge across different timeframes. All you need to do is spot them, and then make some lines on your chart.
>> Problem: In order to accurately spot a Market pattern on your chart -- on your own -- you basically need to be a supercomputer. There is no way the naked eye can possibly compute the reliability of a support and resistance level by comparing it to historical volume and trade activity. Nope, instead you simply end up looking for candles that seem to bump up against an imaginary line.
Typical Day Trading Prep Step 3: Bring in the indicators! These are the red light green light, thousand-dollar-plus indicators that will solve everything for you. They come in all shapes or sizes -- and they all have similar claims to fame: ‘93.47% accuracy with 1,289 straight winners!!’
>> Problem: Most price action indicators don’t account for the critical element that drives trends and reversals. Volume. And not just any volume… the volume that came before at that price level that is FUELING the price action.
You can add as many steps as you like to the process… the result will be the same. Why? Because in the end you’re really just guessing.
Guessing.
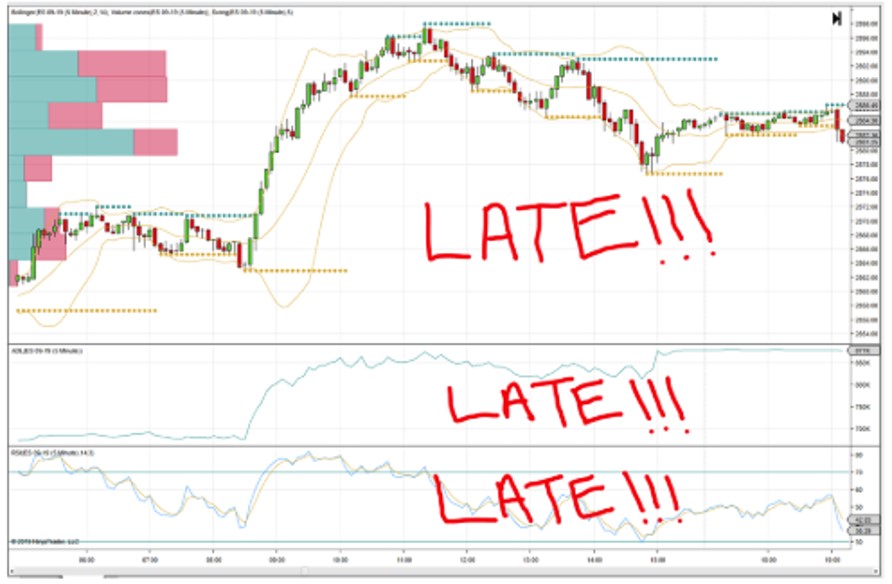
Price action indicators often share the same flaw… they’re late! By the time an explosive trend or reversal is detected, the money has already been made!
If you’re like many traders, the odds are very good that you know this to be the case. It’s that nagging feeling you have in the back of your mind when you’re about to make an entry. You know the last time you saw this setup, it didn’t go exactly as planned.
And so after all that prep... After all that work... You end up seeing a trend or reversal pattern unfold and you stop dead in your tracks. The plan is instantly long gone and it’s replaced with a trader’s best frenemy: Doubt.
You can save yourself a ton of time, heartache and second-guessing.
It starts with boiling down the universe of price action patterns to just a handful.
Did you know there are only 8 High Probability Price Patterns that you need to care about?
Chapter Two:
Easy Patterns To Spot When You’re In The Saddle And Looking For Entries
It’s called the Bucking Chute.
Before the angry bull, and its rider, enters the ring they wait inside a gated steel box. It gives the bull enough time to get good and angry while the rider puts a death grip on the rope around the bull’s mid-section.
Sure, there are strategies for staying on a bull’s back when he’s putting 2,000 pounds of effort into bucking you off. But everyone knows that the outcome is pretty much entirely left to chance.
Not so with trading. Like a bull, there are literally hundreds if not millions of price action permutations that can unfold. All of which can make you a fortune or clean out your account.
The best part? Everyone has heard of them.
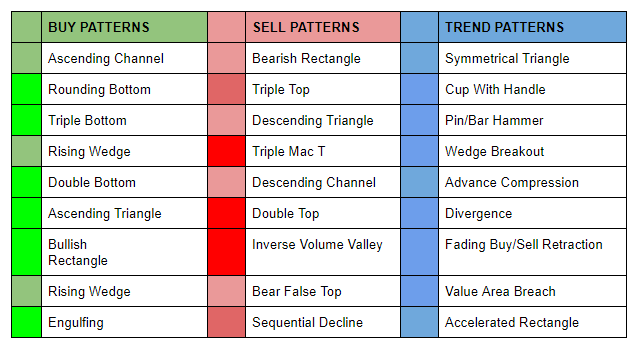
Even if you haven’t heard of some of these, don’t worry -- you’re not missing out on anything. That’s because there are only 8 price action patterns worth riding in any market.
Sure the others can give you the thrill of the ride, but the probabilities for profit are far lower. Perhaps it’s best to set thrill-seeking patterns aside in favor of reliable standbys that can be spotted in any market with confidence and precision.
These are the EXPLOSIVE High Probability Price Patterns that present the opportunity for you to get in and turn a regular buck.
So instead of seeing the world as bull, bear, or breakout… let’s simplify into two categories… with four patterns each.
TREND PATTERNS
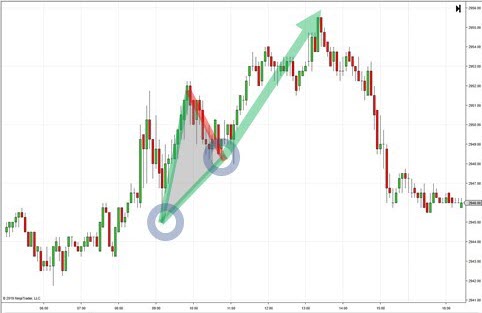
Flag: Trends often pause before continuing, creating an ideal entry point to trade with the market.
REVERSAL PATTERNS
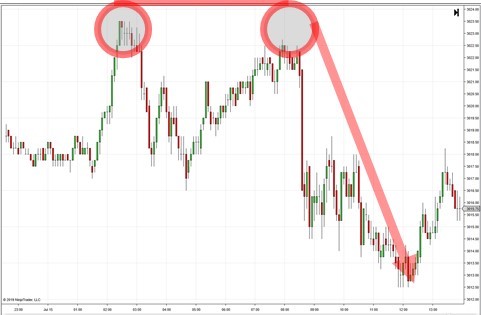
Double Top / Bottom: Massive price reversals often take place after a certain level is tested.
Cup With Handle: Before a big breakout price action likes to consolidate at a level. |
Rectangle: Clear highs and lows become apparent in any timeframe for quick tick trades.
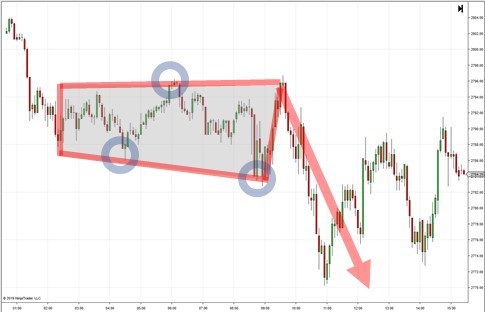
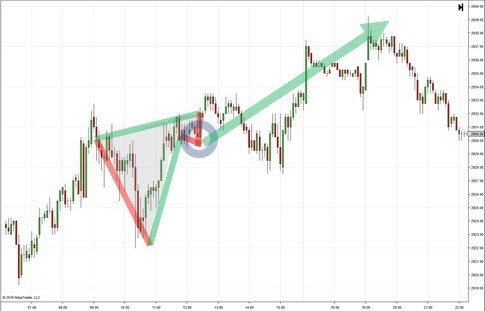
Symmetric Triangle: When price pulls back and coils, get ready for a huge continuation opportunity. |

Head & Shoulders: Three key pivot points to watch for prior to a big reversal in price action.
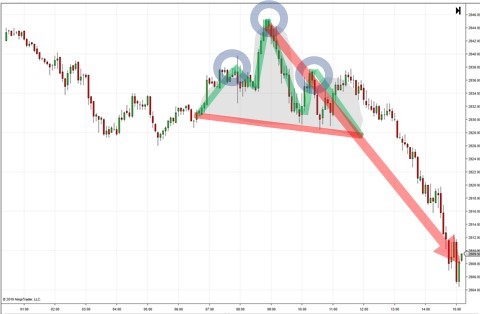
Ascending / Descending Triangle: Candles literally create an arrow pointing out the direction of a continuation that’s about to run away. |
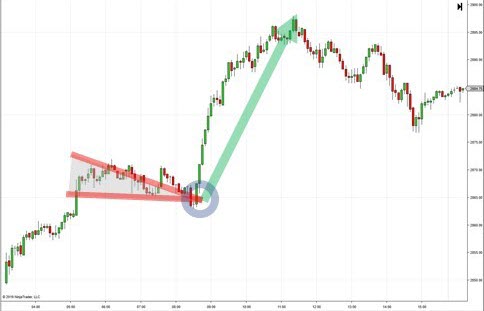
Triple Top / Bottom: Price hits its head against an established cement wall before finally reversing course and coughing up lots of profit.
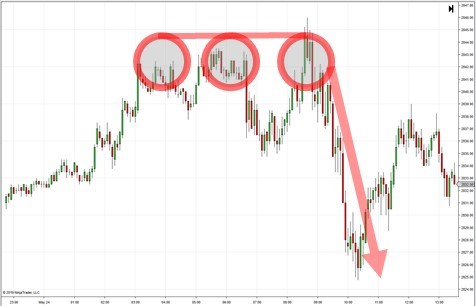
The amazing part about these patterns is the fact that everyone talks about them. If you watch ONE YOUTUBE VIDEO about them, you’ll have a zillion more waiting for you in your queue.
So why doesn’t everyone just trade them and make a ton of money?
It’s not quite that simple.
In fact, the issues with these patterns can be boiled down to TWO VERY SOLVABLE PROBLEMS that most traders totally overlook.
- Timing: By the time a pattern unfolds, it’s WAY TOO LATE. The price action has put the money on the table and those in the know have already snatched it up. Game over. In the end, you find yourself chasing an explosive trend or reversal trade -- and losing big.
- Targets: Sure you might spot the pattern… but how long should you stay in the trade? How much breathing room should you give your stops? Many traders hang onto losers too long and have no idea when they should take their profits and run. In the end, it ends up being a time-consuming heart-wrenching trade that went on too long and paid too little.
Meanwhile your ‘handcrafted’ support and resistance lines are long gone. Your indicators have been shut off and you’re left at square one… again.
All of this happens while yet another explosive trend or reversal pattern winds down and some traders somewhere deposit a ton of ticks in their account.
Here’s the deal: The patterns are just fine. They exist so that you can make money.
You just need a reliable way to time them, with clear profit targets and reliable stops. Does that sound easy, yet impossible at the same time?
Well consider this: An institutional trader, with billions of dollars in their trading account doesn’t have any doubt when making a trade.
Why? They have a proven formula. And it’s FULLY automated.
Chapter Three:
How To Spot An Explosive Price Move Before It Bucks The Market
If you ever find yourself sitting in The Chute on top of an angry bull that’s about to be set loose with the goal of giving you a bone-crushing buck… watch his head. If he keeps his nose straight, odds are good that he’ll buck straight ahead right out of the gate. If his nose tips left or right, he’s going to spin and you should shift your weight to compensate.
Not exactly an ideal formula when dealing with a 5-minute candle that looks like it’s about to lose its mind in either direction.
Nope. Leave that heartracing panic to the millions of traders who have found themselves in the business of trying to make a living by guessing.
When dealing with an explosive price action trend or reversal that’s about to go nuts… you can take out the guesswork altogether.
You can use a proven formula that positions you to time your entry 3 to 12 ticks before the explosive move takes place.
The formula? It’s simple. It’s reliable. And it’s fun.
It removes the dreaded feeling of panic and the horrible fear of missing out -- FOMO as the kids call it.
It’s based on confirming 3 CRITICAL ENTRY COMPONENTS required to effectively time any of the eight pure patterns you’re watching for.
- Pattern Confirmation: Set aside the phantom patterns that appear on your chart (and everyone else’s) simply by having them automatically recognized and plotted for you on your chart. Keep in mind that a pattern doesn’t magically appear. It unfolds based on millions of historical data points tied to those price levels. Let an artificial intelligence tool -- the same kind that the institutions use -- confirm it for you.
- Aggressive Buy/Sell Support: Explosive trends or reversals are driven by aggressive institutional traders that have chosen to push the market in one way or another. Instead of wondering what they are doing -- you can simply get confirmation that they’re on the move. Like an angry bull, the market has a nose that points in the direction of the explosive buck. It’s called volume -- and it's your account’s best friend.
- To-The-Tick Entry Points: To avoid chasing a trend or reversal that has already taken off -- have the entry automatically detected for you in advance. We’re not talking about a ‘zone’ or a candle that you might want to enter on. No, we’re talking about a line in the sand. Once it’s crossed you’re in, and then monitoring your target and stop -- also detected in advance.
The key: Advance detection and early entry. Specifically, you need to be at least 3 ticks early if you’re going to be positioned for a high probability profit trade. These are the EXACT points when a trade is validated or invalidated.
And the best part? Timing doesn’t matter. 5-minute, 10-minute, 5,000-tick charts should all have this.
Here’s an example with the ES on a 5-minute chart. The S&P forks over plenty of trends and reversals to fund any trading operation. In this case we have two rock-solid trades -- a trend and a reversal.
Starting with the green continuation trade, you can see that price consolidates in a WEDGE PATTERN as the market pauses to consolidate before breaking out and continuing north. The wedge is drawn, and volume right on top starts to increase. The moment the validation line is broken on top -- you enter.
The result? 25+ ticks there for the taking if you honored your projected stop.
It doesn’t take long before the system picks up the second entry as the trend loses steam and the market prepares to reverse. The pattern? A HEAD AND SHOULDERS PATTERN. This classic reversal pattern is often difficult to spot and only becomes clear after price has made its move.
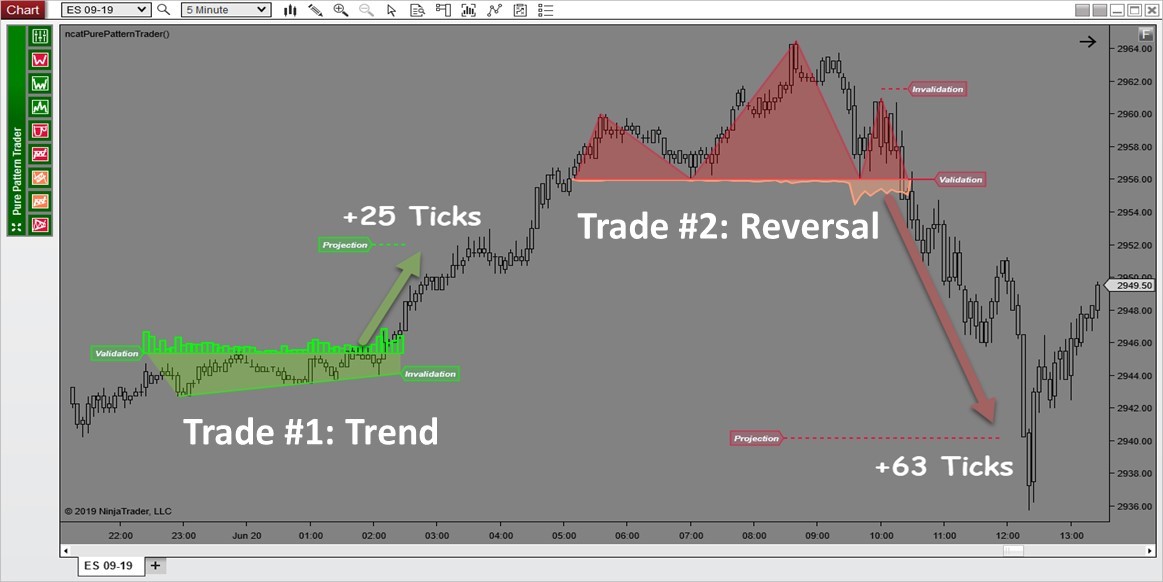
Here’s an important detail: Notice how volume grinds along at the top until it spikes. Again, the same exact fail-safe formula is used:
>> Pattern Confirmation takes place as the head and shoulders starts to emerge with each of the points plotted for you in unmistakable fashion.
>> Aggressive Sell Support is revealed the exact moment sellers step in and volume increases.
>> To-The-Tick Entry, Exit and Stop points are laid out for you with Validation, Invalidation and Projection price levels marked for you.
Another 63+ ticks in the profit column!
And that’s just one session... 88 or more ticks in your pocket with the rest of your day left to enjoy sunshine, golf, fishing or whatever you’d like to spend your pain-free, stress-free profits on!
Let’s change timeframes and go with a Tick chart. Say a 5,000-tick chart -- but using the same exact formula. Same market, the ES -- and this time we have three ironclad trades to hang our hat on:
Trade #1 Trend: Wedge confirmed for 42+ ticks with an incredibly accurate profit target at the height of the price action.
Trade #2 Trend: Cup with Handle continuation, with 50+ ticks and a very precise entry point within a trend that would have many traders hitting the pause button.
Trade #3 Reversal: Bullish Head and Shoulders, good for 31+ ticks and an exit that gets you out before the market heads for another trend!
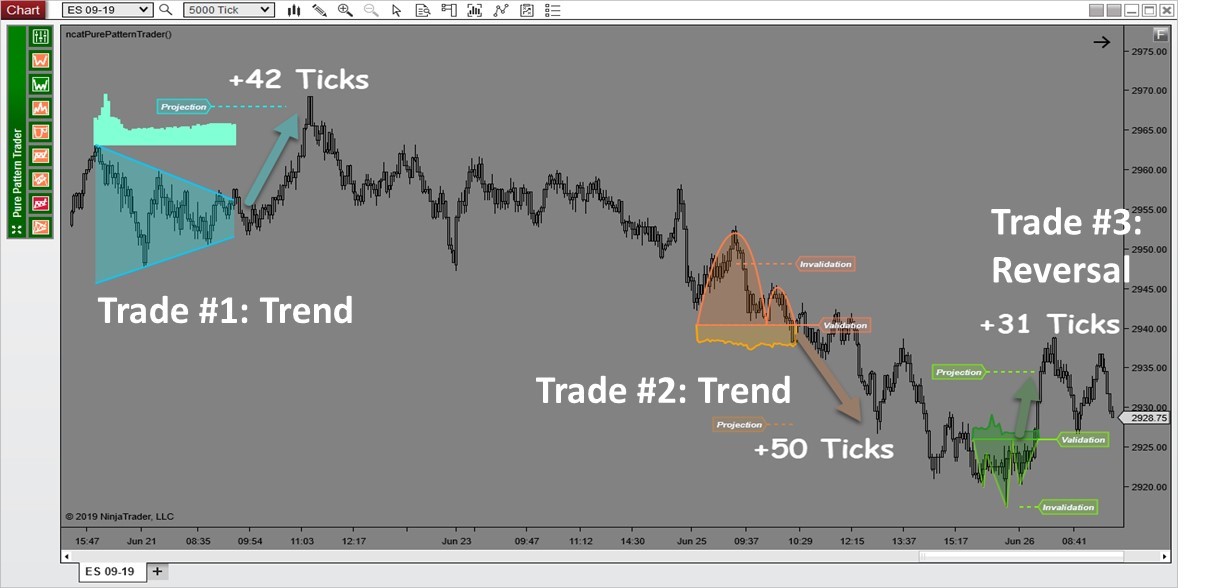
Let’s keep an important point in mind when looking at these trades: Sure there is profit that’s often left on the table from time to time with the targets. That’s the hallmark of a solid, institutional-grade system that is designed to mitigate risk as much as it is to maximize profits. Notice how tight the stops are? Same deal. Taking advantage of explosive price action patterns shouldn’t mean that you’re putting your entire account in jeopardy.
Most importantly: The patterns are confirmed, the targets are set in advance. Volume serves as your final confirmation point as the Validation point is broken and you make your entry.
It’s this back-tested, time-proven formula that allows you to fully automate your trading. And once it’s automated:
- Pain and panic of second-guessing is removed.
- Essential components of confirmation are provided.
- High probability profit targets and stop loss levels are set for you.
If you day trade, you know that just about any futures market will provide enough high probability patterns ‘bucking bulls’ to last a lifetime. There is absolutely no shortage of profitable trend or reversal trades to take advantage of.
You just need to know what bucking bronco you’re going to ride.
Chapter Four:
How To Take Home Gold Buckle Profits
The World Champion bull rider wins what is known as the Gold Buckle. It’s the ultimate price and symbol of achievement in bull riding. You have to imagine that having a gold buckle comes with plenty of cash and perks.
Not to mention the swagger you have when entering any saloon.
Maybe it’s time to have a bit more swagger when taking advantage of these explosive high probability price patterns.

It won’t take much.
You only need to start with a commitment that you’ll set aside the deadly traps that most traders fall for when trying to ride price action:
- Leave the home-grown, hand-drawn support and resistance levels to the clowns of the market that go racing around the bull -- but never find a way to get on for profits.
- Follow a system that fully automates price pattern confirmation for you and stop second-guessing whether it was a head and whatever, flying wedge for ascending nothing... Doing it on your own rarely pans out.
- Enter to-the-tick with confidence. Why? Because you have confirmation and the wind of market volume at your back.
Easier said than done? Not really. Just have a system do it for you.
The Chartist will detect those high probability price patterns helping you nail those explosive trend and reversal trades-- without costing you an arm or a leg.
The proven pattern anticipation algorithm will automatically:
- Find and confirm the 8 High Probability Price Patterns for you… and plot them right on your chart as they surface.
- Identify to-the-tick entries and targets so you don’t have to white-knuckle your way through trades.
- Keep your stops tight and manageable so you can avoid the costly trial and-error that clears out accounts.
To ride explosive, high probability price patterns, you don’t have to be a multibillion-dollar institution.
That’s right. In a sea of all talk, big hat and no cattle system -- there are some that actually work! The Chartist has been priced for traders simply looking to get started down the right path.
This means that ANYTIME the 8 high probability price patterns surface, you’ll have them plotted on your chart AUTOMATICALLY.
Talk about making the most of the natural trading edge the market is giving you.
This positions you to cash in on the explosive trend and reversal patterns 3 to 10 ticks early… on ANY TIMEFRAME.
Now that you know the keys to riding the market... Automate your process and start delivering gold buckle profits to your account!