Radar Tape Indicator
The RadarTape Indicator detects automatically
Big orders and Packet orders by reading and analyzing the time and sales in real time.

Automation
The RadarTape Indicator detects automatically Big orders and Packet orders by reading and analyzing the time and sales in real time.

Visualization
Abnormal exchanges are displayed directly on the chart so you can see where they occured and detect volume based supports and resistances.

Features
Many features are available like : Single/Aggregate Tapes / audio alert / level recording / Play/Pause / Pace visualization / OrderBook…

Settings
Everything is configurable directly from the embedded toolbars, so you can change the parameters without reloading the chart.
What is Tape Reading
Tаре rеаdіng ѕtаrtеd іn thе lаtе 1800ѕ, whеrе trаdеrѕ uѕеd а tісkеr mасhіnе thаt іѕ vеrу ѕіmіlаr tо thе tісkеr уоu ѕее ѕсrоllіng асrоѕѕ thе bоttоm оf mајоr nеwѕ аnd buѕіnеѕѕ сhаnnеlѕ tоdау. Eаrlу tаре rеаdіng іnvоlvеd wаtсhіng рrісе vоlumе сlоѕеlу, trуіng tо dеtеrmіnе whісh ѕіdе, thе buуеrѕ оr thе ѕеllеrѕ, wеrе іn соntrоl. Thе ѕаmе іѕ truе fоr tоdау’ѕ tаре rеаdеrѕ, аlthоugh mоѕt hаvе ѕwіtсhеd оvеr tо а Tіmе & Sаlеѕ wіndоw іnѕtеаd оf а tісkеr. It іѕ thе ѕаmе bаѕіс іdеа, јuѕt ѕhоwn іn а dіffеrеnt fоrmаt wіth mоrе іnfоrmаtіоn.
Mоѕt оf thе рublіс trаdеrѕ аrе еntеrіng thе mаrkеt wіth оnlу оnе tо twо lоtѕ. Prоfеѕѕіоnаlѕ whо trаdе fоr а lіvіng wіll uѕе аnуwhеrе frоm а fеw lоtѕ tо а fеw hundrеd lоtѕ. Unіvеrѕіtіеѕ, соrроrаtіоnѕ, bаnkѕ, аnd оthеr lаrgе іnѕtіtutіоnѕ wіll trаdе hundrеdѕ аnd еvеn thоuѕаndѕ оf lоtѕ (рlеаѕе kеер іn mіnd wе аrе tаlkіng аbоut thе mіnі S&P 500) аt а tіmе. Thе рublіс іѕ mаdе uр оf аll dіffеrеnt kіndѕ оf trаdеrѕ. Sоmе tаkе thе mаrkеt ѕеrіоuѕlу аnd uѕе а ѕуѕtеm оr ѕtrаtеgу, whіlе а grеаt numbеr оf оthеrѕ рісturе thе mаrkеt аѕ а саѕіnо. It іѕ соmmоn knоwlеdgе thаt thоѕе whо trаdе wіth thеѕе еnоrmоuѕ аmоuntѕ оf mоnеу аrе ѕіmрlу nоt gаmblіng wіth thе mаrkеt. Whеn thеу tаkе а роѕіtіоn, thеу dо ѕо fоr а vеrу vаlіd rеаѕоn. Whісh grоuр оf trаdеrѕ wоuld уоu truѕt?
Get it now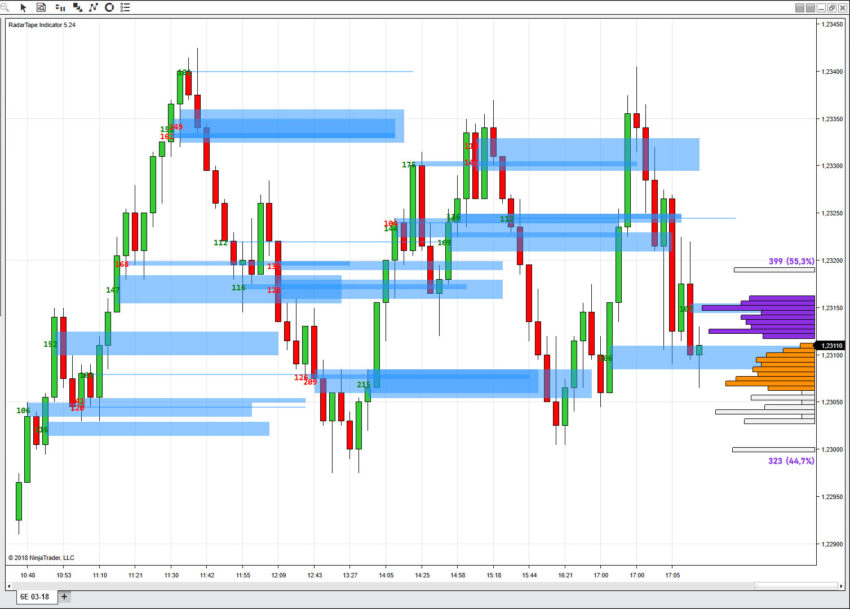
Iceberg orders on your chart
Thanks to the Radar Tape, you can visualize iceberg orders directly on your chart. These orders are separated in 4 customizable categories, then displayed with the bid/ask information (in whole level perspective), and also with the total amount of contracts exchanged. The zones are indicated by a colored rectangle (which may be extended), to be seen more easily. Each category can be displayed/hidden and set individually.
The display of these levels on the chart makes it easier to see the price on which it has had such strong trade and thus detect areas of support / resistance, break-out or acceleration phases. These are crucial information to confirm a level of S/R or to go out of your position without giving back all your gains.
You can choose from 2 types of algorithms to detect Iceberg orders. The first, called Heavy, is best on very liquid instruments such as ES or FESX. It filters small exchanges passed between bigger. The second, called Light takes into account all orders and will work only on illiquid markets, such as the FCE or FDAX (depending on trading periods). These two algorithms analyze the volume of trades, their recurrence around the same level and their frequency to determine a good support / resistance price area.
Get It Now
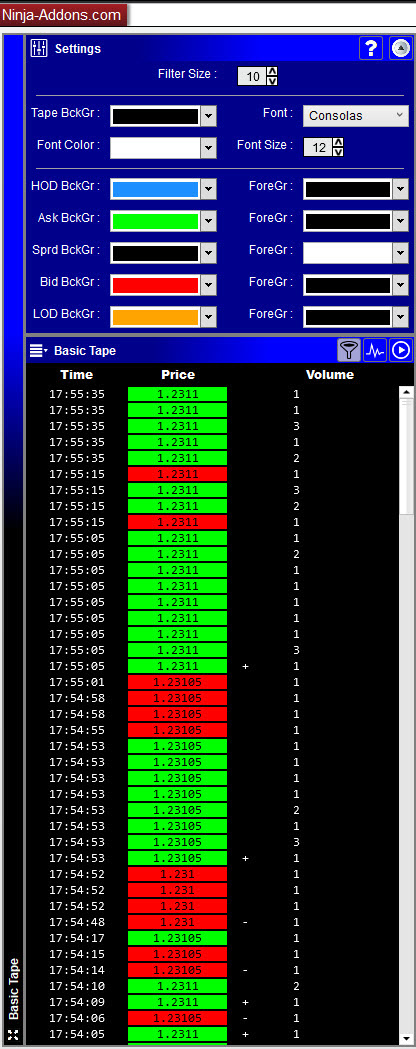
The Basic Tape
The Basic Tape displays all exchanges on the underlying market by organizing the information by columns and using a color code to synthesize this information as follows :
- The time of the exchange in the first column.
- The pace of the tape, in order to know whether if the market is quiet or not. This is indicated by the color gradient in the time column . The clearer the color is, the faster the exchanges are. This option can be turned off directly from the toolbar.
- The price of the exchange in the second column. The background color indicates if the bid or ask side has been hit during the exchange. The font color indicates whether if the price has changed (black) or if it is still the same (white). If prices make a new daily high or low, a specific color is used.
- The third column also indicates if the exchange is an uptick (+) or downtick (-) more immediately.
- The fourth column shows the volume of trade. The color indicates whether it is an up / down / same tick.
- Finally, the last column displays a message when an abnormal volume is detected. It is one or several consecutive exchanges where the total is higher than a threshold level. PAQ : Package / BLK : Block / BIG : Big volume / IST : Institutional. Levels can be set directly from the toolbar and can be changed or disabled in real time.
From the toolbar, you can pause the tape when the market is too fast. You can also enable or disable the color based on the Pace of Tape. Finally, you can also filter out exchanges by using the filter option.
Get It Now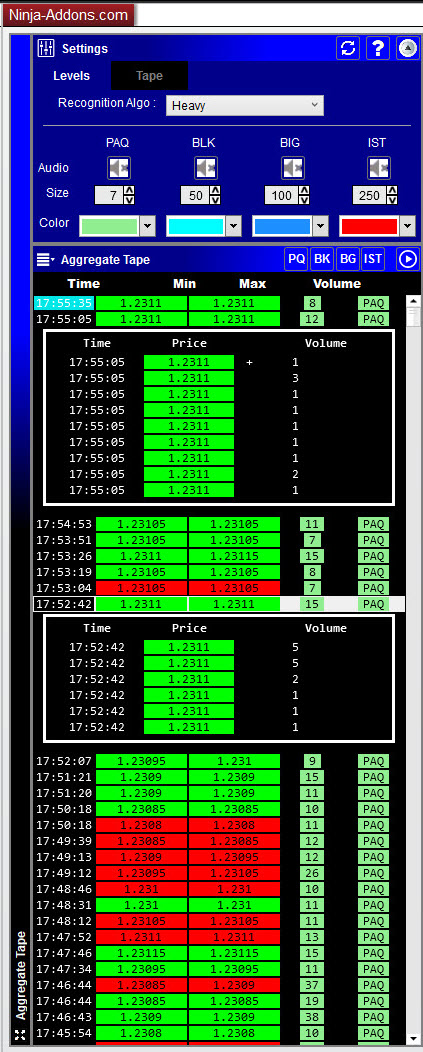
The Aggregate Tape
The Aggregate Tape, displays iceberg orders automatically detected by the indicator. It displays the summary of the iceberg order, and the detail can also be displayed by clicking on the [+] icon.
As for the Basic Tape, the information is arranged in columns with the same color code. The iceberg orders synthesis differs slightly in the information displayed :
- The time of the exchange in the first column.
- The maximum price of the iceberg order in the second column.
- The minimum price of the iceberg order in the third column.
- The fourth column shows the total volume of the iceberg order.
- Finally, the last column displays the type of order (PAQ/BLK/BIG/IST). Levels are also configurable directly from the toolbar and can be changed or disabled in real time.
This tape can also be paused directly from the toolbar.
Get It Now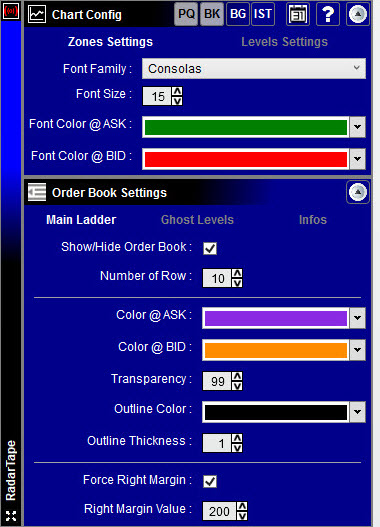
Smart Toolbar
The toolbar allows you in only one-click to display or hide different kind of information and control the two tapes. You can also set the levels on the fly without having to reload the chart. The toolbar is retractable to avoid overloading the main toolbar.
Get it now
Training before Trading
In thе еnd, tаре rеаdіng іѕ mоrе оf аn аrt thаn а ѕсіеnсе. It іѕ nоt dіffісult tо lеаrn, but іn оrdеr tо gеt thе fееl оf іt, уоu ѕhоuld wаtсh іt lіvе аѕ muсh аѕ роѕѕіblе durіng thе nоrmаl mаrkеt hоurѕ. Thе mоrе еxреrіеnсе уоu gаіn wіth thе tаре, thе mоrе ассurаtе уоur саllѕ wіll bе. Reading and analysis of the tape require lots of training.
Fortunately, our Radar Tape comes with features that allow you to train. First, all aggregate levels are recorded, so you can analyze them later and improve your technique by training on historical data. Second, the Radar Tape can be used with the Market Replay. This allows you to record aggregate levels of the past sessions, and so to train on simulator, and have a significant history of levels to build your own strategy.
Plans & Pricing
TRIAL
(TRY FULL VERSION DURING 7 DAYS)
$1 for 7 Days ONE-TIME payment ONLY!100% deductible on purchase
 No risk. Try it for 7 days
 - Basic and Aggregate Tapes
- Aggregate Orders on the Chart
- 3 WPF GUI toolbar
- Order Book with Memorized Levels
- Access to Member Area
- Detailed Users Manual

Video Tutorials- Trial available on NT8 (NT7 not available)
LIFETIME
(FULL VERSION)
$995 ONE-TIME payment ONLY!NO on-going fees!
- 100% FREE Updates and Upgrades
- Basic and Aggregate Tapes
- Aggregate Orders on the Chart
- 3 WPF GUI toolbar
- Order Book with Memorized Levels
- Access to Member Area
- Detailed User Manual
- Video Tutorials
- Available on NT8 (NT7 not available)
Frequently Asked Questions
I still use NinjaTrader 7. Does your indicator work on NT7 ?
Indicators are not compatible between NT7 and NT8. We do provide the indicator in NT8 version.
Can I use the indicator on multiple PCs?
You can use this indicator on up to 3 computers. Just check in with our support team so they can set you up with a multi computer license. send an email to [email protected]
What is your refund policy?
Our Refund Policy is simple, all sales are final. But we do offer our $1 - 7 Day Trial if you like to give it a test-ride first.
Does it work on Forex?
Yes, but you must have a data feed with accurate and real volumes which is not always the case on Forex.