Elliott Indicator
Counting & Tracking Money-Making Elliott Waves Has Never
Been Easier… For Day Traders!

Elliott made Simple
The complex, yet very effective Elliott theory will be a lot easier to apply, not for historical analysis, but for your real-time trading.

Elliott countdown
The Elliott Indicator detects automatically bullish and bearish Elliott countdown and displays it on your chart in real time.

PRZs and ILVs
Elliott Indicator introduces the concept of PRZ and ILVs to help you identify potential Entry/Exit zones and level of confirmation.

Settings
Everything is configurable directly from the WPF toolbar, so you can change the parameters without reloading the chart.
Naturally Find More Winners
With Automated Elliott Wave Analysis
Automates Every Aspect Of Counting And Tracking Money-making 3, 5, A, C Waves.
By a single click on a button, the Elliott Indicators displays Bullish and / or Bearish countdowns, based on your settings. It analyze tops and bottoms found by a zigzag, and their sequence regarding the Elliott Theory, and shows you the countdown directly on the chart.
try it now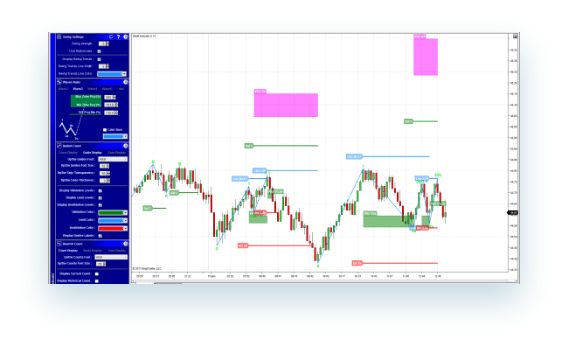
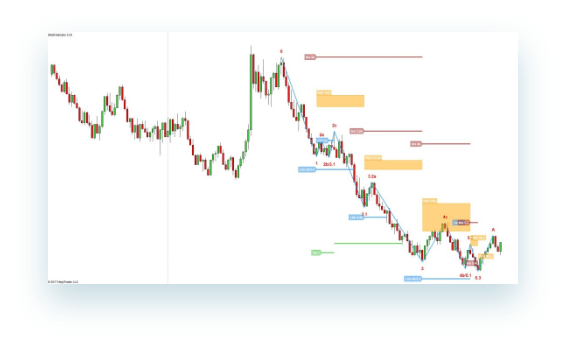
Boost Entry & Exit Confidence With PRZ and ILVs
The Elliott Indicator introduces the concept of PRZ (from the Harmonic Theory) to help find good entry points and objectives zones. It is an area where prices should (at least) pause on a corrective or impulsive wave.
ILVs (Invalidation/Limit/Validation) levels allow you to view at any time, at which price the wave is validate or not. The term limit is the border between two waves. Eg w2b becomes a w3 or w3.1 if it exceeds the limit level (usually the top of w1).
try it now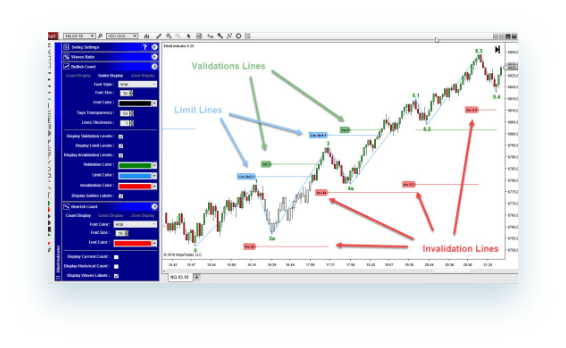
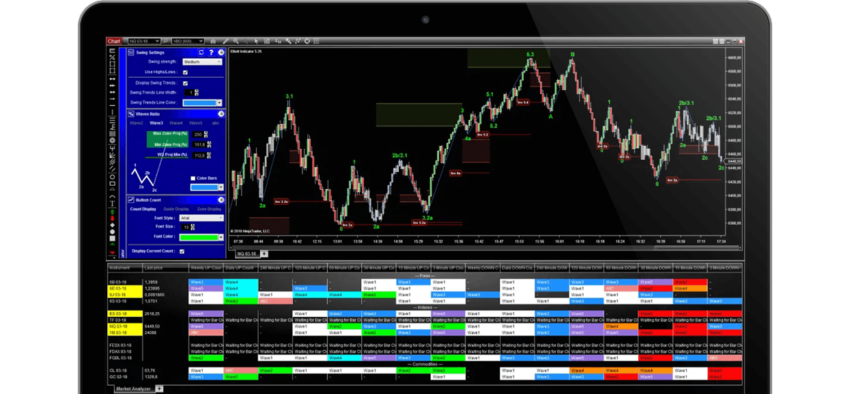
Cherry-Pick The Best Trades From Any Market and Timeframe
By a single click on a button, the Elliott Indicators displays Bullish and / or Bearish countdowns, based on your settings. It analyze tops and bottoms found by a zigzag, and their sequence regarding the Elliott Theory, and shows you the countdown directly on the chart.
try it now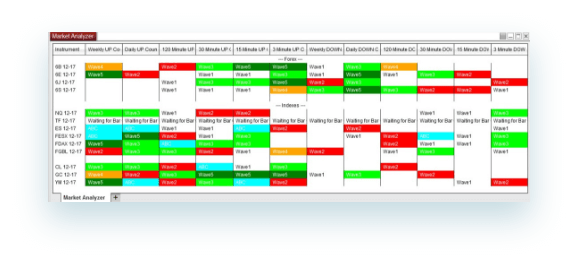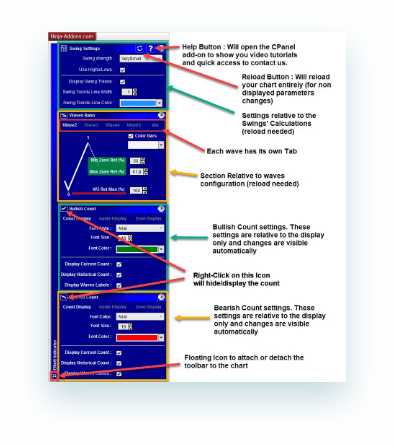
Customize Everything With The Smart Toolbar
In order not to overload the chart with too much information at the same time, we have created a toolbar that allows you to display or hide in only one click, the different information about the Elliott Indicator. That way, you can :
Display or Hide bullish / bearish countdowns independently. Display or Hide ILVs levels that allow you to know the important levels on the current countdown. Display or Hide PRZs area, which are, according to the theory, important zones of reversal.
Display or Hide the zigzag used to calculate the countdown.
Modify in real-time, the parameters of the zigzag, like its speed, its type and its price level used in its calculations (HL or Input). All of this, without reloading the
chart for faster analysis.
Elliott made easy
The Elliott theory applied rigidly, is very difficult to implement in real time. And there’s really no use to find a countdown when the trend is already over. However, the use of this indicator can help you truly trade by applying the principles of this theory. You just have to open a chart, choose the type of countdown to display (bullish / bearish, or both), and adjust the zigzag. Adjust the zigzag’s speed so as to have waves of a size that is convenient for you to trade and that suits the volatility of the moment. And that’s it!
The indicator will detect automatically countdowns in progress, and you can use this information to place your Entry and/or Exit orders. For example, you can wait for the appearance of the W2 PRZ. This area can be used as an entry area, which coupled with a level Iceberg spotted by the Radar Tape, will form an excellent entry level to trade the next impulse wave. You can try to enter in a W2 and remain in position until it is invalidated, thanks to the ILVs. This way you can trade the W3 to its objective level. You can also try to reinforce your position in a W4 pullback, in order to trade the movement until the end of the W5.
Once well mastered, the Elliott Indicator is a great tool to narrow your trading decisions, showing you the areas and levels with high potential, while showing you the general context (on an Elliott point of view) in which you are trading.
Plans & Pricing
TRIAL
(TRY FULL VERSION DURING 14 DAYS)
$1 for 7 Days ONE-TIME payment ONLY!100% deductible on purchase
 No risk. Try it for 14 days
 - Bullish/Bearish Counts
- Display Guide and Zones
- WPF GUI toolbar
- Market Scanner
- Access to Member Area

Access to Special Gift Area- 45+pages Users Manual
- 8 video tutorials
- Include Chart Templates
- Include Scanner Templates
- Trial available on NT8 (and NT7 with less features)
LIFETIME
(FULL VERSION)
$995 ONE-TIME payment ONLY!NO on-going fees!
- 100% FREE Updates and Upgrades
- Bullish/Bearish Counts
- Display Guide and Zones
- WPF GUI toolbar
- Market Scanner
- Access to Member Area
- Access to Special Gift Area
- 45+pages Users Manual
- 8 video tutorials
- Include Chart Templates
- Include Scanner Templates
- Available on NT8 (and NT7 with less features)
Frequently Asked Questions
Quasi architecto beatae vitae dicta sunt explicabo?
Sed ut perspiciatis unde omnis iste natus error sit voluptatem accusantium doloremque laudantium, totam rem aperiam, eaque ipsa quae ab illo inventore veritatis et quasi architecto beatae vitae dicta sunt explicabo.
Quasi architecto beatae vitae dicta sunt explicabo?
Sed ut perspiciatis unde omnis iste natus error sit voluptatem accusantium doloremque laudantium, totam rem aperiam, eaque ipsa quae ab illo inventore veritatis et quasi architecto beatae vitae dicta sunt explicabo.
Quasi architecto beatae vitae dicta sunt explicabo?
Sed ut perspiciatis unde omnis iste natus error sit voluptatem accusantium doloremque laudantium, totam rem aperiam, eaque ipsa quae ab illo inventore veritatis et quasi architecto beatae vitae dicta sunt explicabo.