
-
3 years ago
-

0
-

ABCD Pattern
Introduction
Among harmonic patterns, the simplest is the ABCD pattern. It consists of two equivalent price legs and is not difficult to identify on charts. This is because it has a structure with specific Fibonacci measurements of each point. This factor removes chances of a flexible interpretation.
The ABCD is a reversal pattern that indicates when the stock price is about to change direction. It helps you buy stock when the price is low and about to rise, or sell the same when it is high but about to plunge.
Description
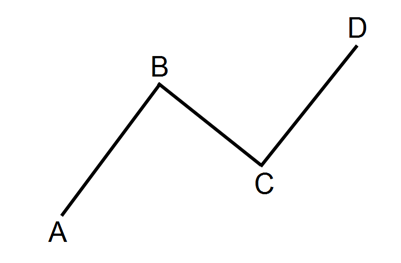
In the ABCD chart pattern, there are a total of three legs. AB and CD are two equal legs, while BC is the correction or retracement. Altogether, they form a zig–zag shape on the price chart. Due to this, the pattern is also known as the “lightning bolt pattern”. It can be applied on any time frame and any financial market as well. This is what it typically looks like:
There are two types of ABCD patterns – bullish and bearish.
- Bullish ABCD
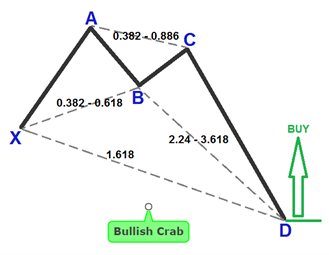
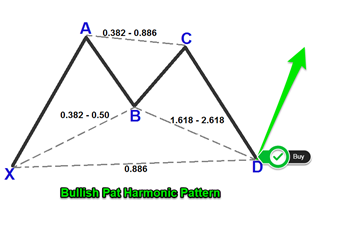
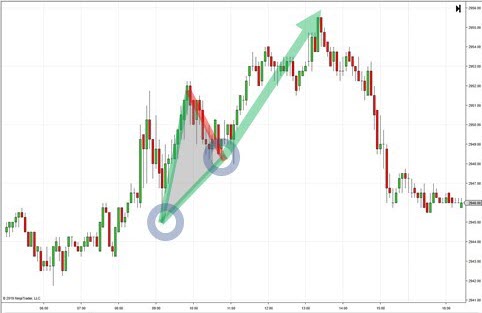
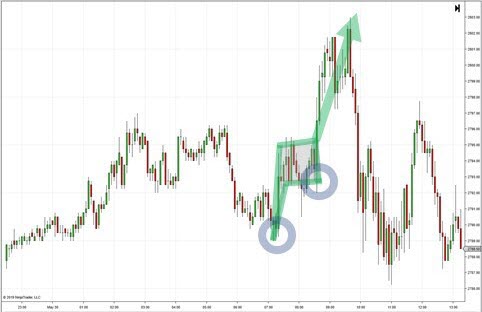
The bullish ABCD pattern begins with a price decrease (AB). This is followed by a reversal and a price rise (BC). BC then undergoes a reversal again and CD, a new bearish move, is formed which moves below the bottom created at point B. After the price completes the CD price move, a reversal is expected, and the price is supposed to move higher.
This is shown below:
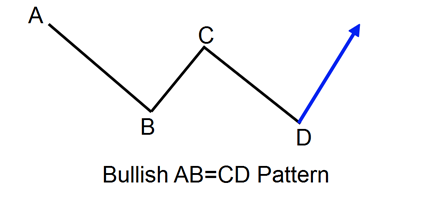
In the bullish ABCD pattern, AB is bearish, BC is bullish and CD is bearish. The outcome is expected to be bullish.
- Bearish ABCD
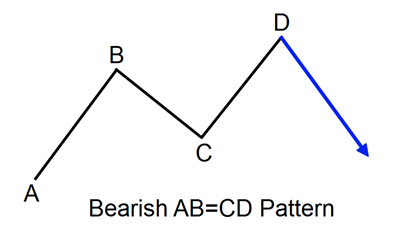
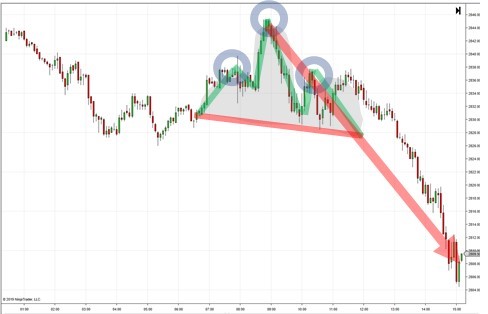
The bearish ABCD chart pattern is similar to the bullish ABCD, except that everything is upside down. This pattern begins with a bullish AB line. This gets reversed by a new bearish move (BC), which again gets reversed by a new bullish move (CD). The CD line moves above the top at point B. In such a scenario, the stock price is expected to create a new bearish run by reversing again. This is shown below:
In the bearish ABCD pattern, AB is bullish, BC is bearish and CD is bullish. The outcome is expected to be bearish.
General Rules
Once the ABCD pattern is identified, you can begin to look for a trading opportunity at point D. It is noteworthy that there are three price movements that take place before the confirmed ABCD pattern – AB, BC and CD. Only when the length of CD is equal to AB, can we begin to think of trading.
When you have decided where you think the pattern will complete, which is point D, you should place a sell or buy order at this point with a mind to profit from a price reversal.
There are two basic Fibonacci rules associated with the ABCD pattern. These are:
- BC – 61.8% Fibonacci retracement of AB.
- CD – 127.2% Fibonacci extension of BC.
At the same time, the AB and CD price moves need to take roughly the same time to develop. If you see the price action forming an ABCD pattern and the swings matching with the particular Fibonacci ratios, there is a very strong probability signal on the price trend.
To enter the market on the ABCD chart pattern, you want to be sure of the pattern’s validity first. If you find that the pattern accords to the above–mentioned rules, thereby confirming the formation of ABCD, it is probably the right time to initiate trade. You want to trade in the direction of the bounce running counter to the CD leg to make the maximum profit.
Conclusion
The ABCD pattern, therefore, is a four–point harmonic pattern that forms the basis for other harmonic patterns. The A–B leg is formed when the stock price moves upward or downward from A to B. The B–C leg marks a change in direction and retraces upwards or downwards 38.2%–78.6%. At point C, the price changes again and continues with the original trend. The CD leg should be of the same length as AB on completion.
It is a preferable for a beginner in harmonic trade to begin with the ABCD pattern before moving to other advanced harmonic chart patterns such as the Bat, Crab and Butterfly.
Source Links:
https://learn.tradimo.com/advanced–chart–patterns/ab–cd–pattern
https://www.babypips.com/learn/forex/the–abcd–and–the–three–drive
https://www.tradingview.com/ideas/abcdpattern/
http://www.brameshtechanalysis.com/2016/09/understanding–abcd–harmonic–pattern/
http://forextraininggroup.com/using–the–harmonic–abcd–pattern–to–pinpoint–price–swings/
http://www.forexabode.com/forex–school/watch–out–for–patterns/rectangles/
https://learn.tradimo.com/advanced–chart–patterns/bullish–rectangle
Browse Categories
Featured Posts
 3 years ago
Cypher Pattern
 3 years ago
Crab Pattern
 3 years ago
Butterfly Pattern
 3 years ago
Bat Pattern
3 years ago
ABCD Pattern
 3 years ago
The Rectangle Pattern
 3 years ago
Triangle Patterns
 3 years ago
Flag Pattern
 3 years ago
Double and Triple Pattern
 3 years ago
The Cup with Handle Pattern
 3 years ago
The Head-and-Shoulders Pattern
Popular Posts
Cryptomining
3 years ago