
-
3 years ago
-

0
-

Butterfly Pattern
Introduction
The Butterfly Pattern is a unique 5-point extension pattern. Bryce Gilmore discovered it and Scott Carney further defined it. The structure has specific Fibonacci measurements for each point. It is important because it conventionally provides more favorable risk/reward ratios. The pattern can be found at significant tops and bottoms. Additionally, the failure of the pattern may mark a strong continuation move.
Description
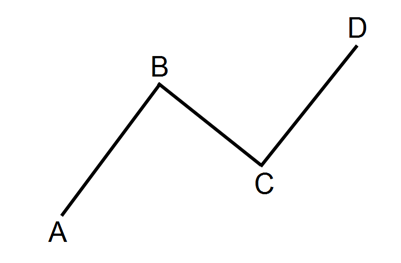
In harmonic trading, the Butterfly is a reversal pattern that is made of 5 swing points – X, A, B, C and D. Since D is located above X, it isn’t referred to as point D but rather as a zone in which the stock price is likely to reverse. In this sense, it is also known as the Potential Reversal Zone (PRZ). It helps define where the stop loss order needs to be.
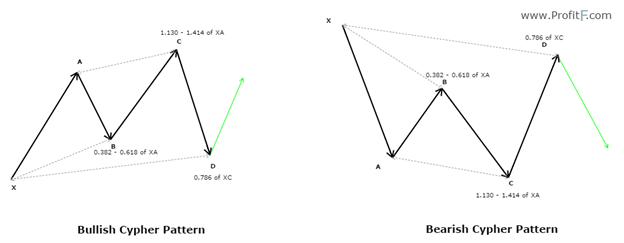
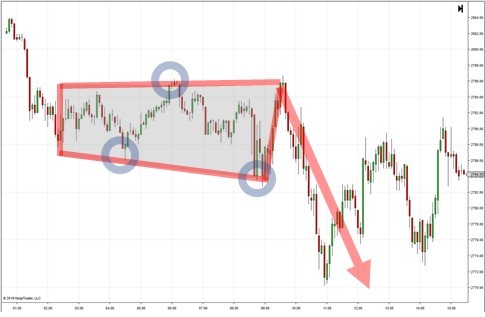
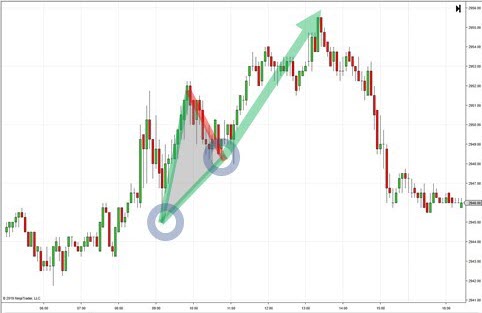
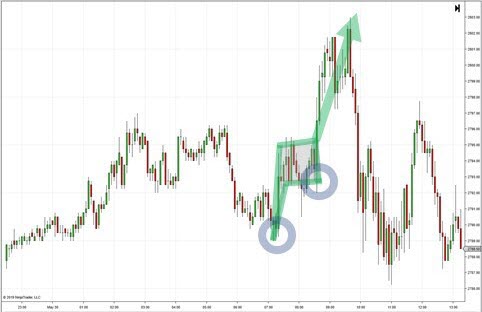
Like the other harmonic trading patterns, there are bullish and bearish versions of the Butterfly. These are shown below:
For the formation of this pattern, you need to check the following criteria:
- The B point needs to be at 78.6 retracement of XA
- D is at 1.27 Fibonacci extension level of XA
- Point C is a 50 or 61.8 retracement of AB
- The AB and CD legs lead to the creation of an AB=CD pattern
General Rules for Trading in the Butterfly Pattern
Firstly, the B point retracement of the primary XA leg has to be 0.786.
The PRZ should consist of 3 converging harmonic levels, namely, (i) a 1.27 extension of XA, (ii) AB=CD pattern, with AB and CD being equivalent or 1.27 and (iii) BC at 2.00, 2.24 or 2.618.
The first target should be the 382 retracement of AD and the second target the 618 retracement of AD.
The common stop levels are after the D point or the 1.41 extension of XA.
The distinguishing feature of the Butterfly is its symmetry between the two triangles that join at point B. The pattern resembles a skewed “W” or “M” shape on the price chart that is similar to the Gartley pattern. However, whereas the Gartley completes when a Fibonacci retracement and extension converge, the Butterfly completes when two separate Fibonacci extension levels converge.
Potential Reversal Zone
For harmonic patterns, stop loss orders need to be above X for a bearish pattern or below X for a bullish pattern. In the Butterfly pattern, D is already beyond X.
The PRZ in the Butterfly pattern is formed by using Fibonacci extension and inversion levels. It is located at extreme price levels and enables you to trade underlines shares that are generally highly overbought or oversold.
It is noteworthy that the Butterfly pattern is basically a counter-trend pattern that depends on a temporary directional change in the trend. This does not make it the most reliable pattern and there is always a significant amount of risk associated with it.
Conclusion
The Butterfly pattern is created by the intersection of two symmetrical triangles. The main benefit of this structure is that it enables you to enter the market at extreme highs or lows. If identified correctly and used for entering trade at the most opportune time, the pattern can lead to good returns for stock investors.
Source Links:
https://www.moneyshow.com/articles/daytraders-19518/
https://www.tradingview.com/ideas/butterflypattern/
http://www.themarketzone.net/?p=3927
https://www.investoo.com/bearish-bullish-butterfly-pattern/
Browse Categories
Featured Posts
 3 years ago
Cypher Pattern
 3 years ago
Crab Pattern
3 years ago
Butterfly Pattern
 3 years ago
Bat Pattern
 3 years ago
ABCD Pattern
 3 years ago
The Rectangle Pattern
 3 years ago
Triangle Patterns
 3 years ago
Flag Pattern
 3 years ago
Double and Triple Pattern
 3 years ago
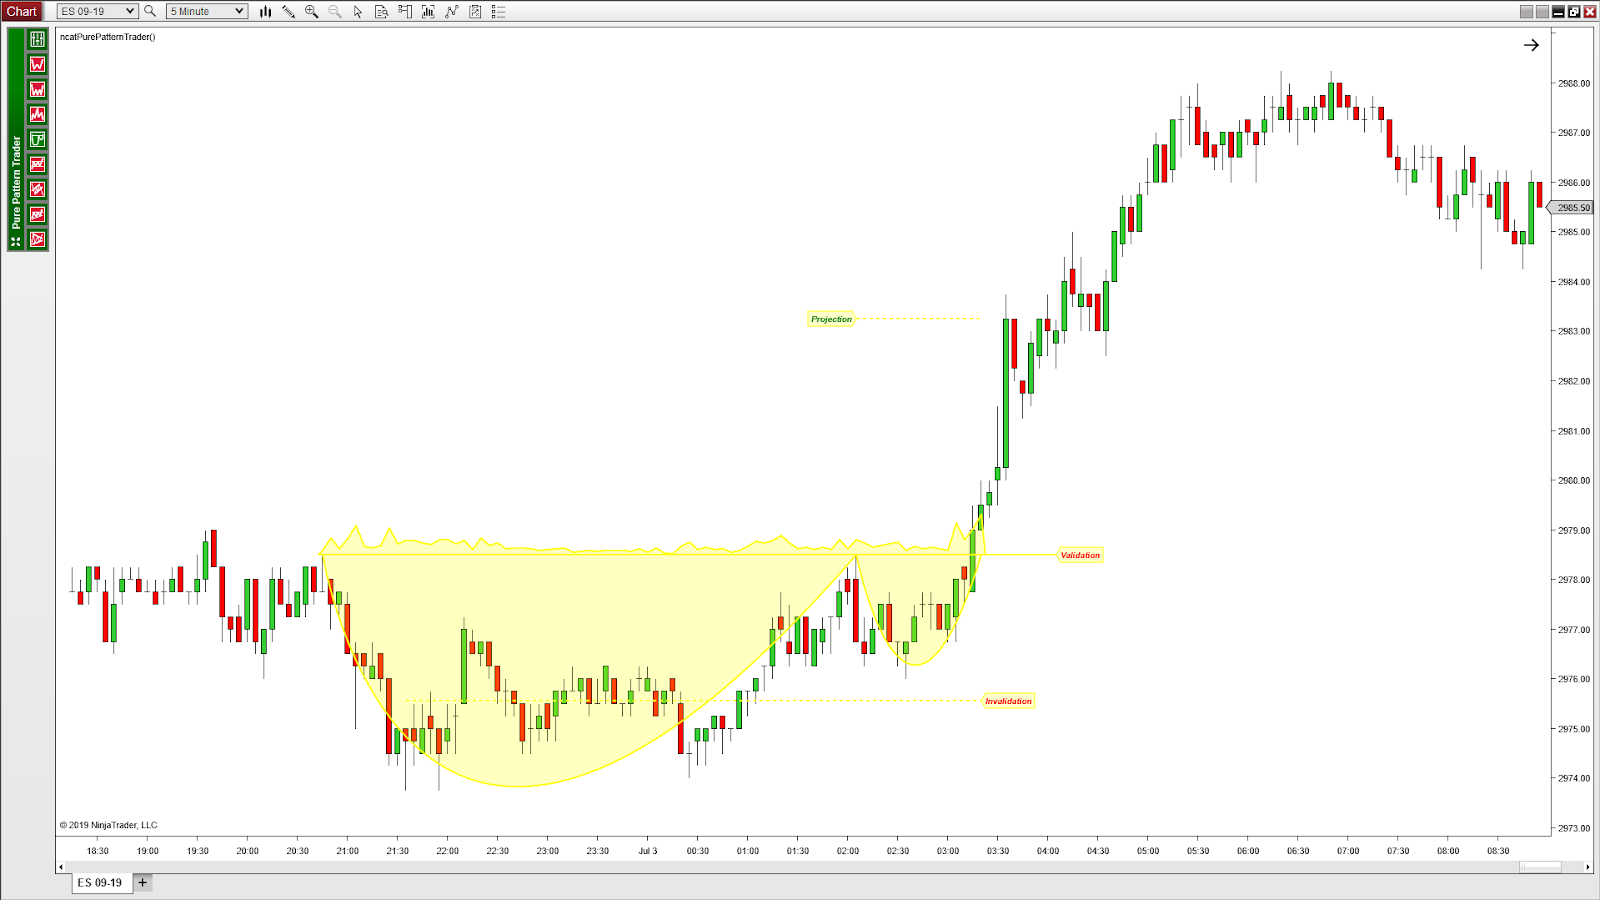
The Cup with Handle Pattern
 3 years ago
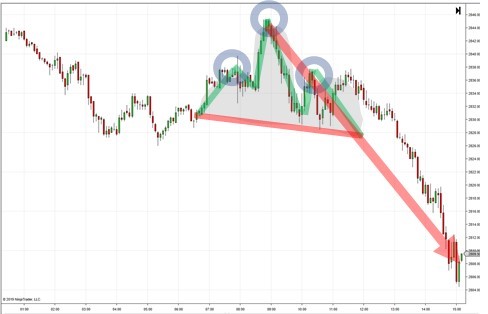
The Head-and-Shoulders Pattern
Popular Posts
Blockchain
3 years ago
The Cup with Handle Pattern
3 years agoRipple and Stellar
3 years ago