
-
3 years ago
-

0
-

Crab Pattern
Introduction
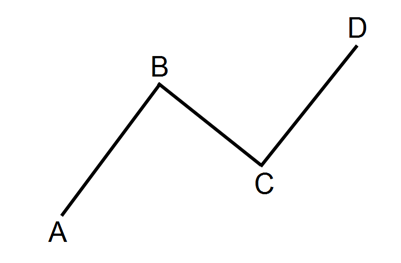
In harmonic trading, the Crab is a reversal pattern that constitutes four legs, namely, X–A, A–B, B–C and C–D. Like the Butterfly pattern, it makes possible entry into the market at extreme highs or lows. It can help you identify when a price trend is approaching its end. This enables you to enter the market just as the stock price reverses direction, using it to your advantage.
This pattern was discovered by Scott Carney in 2001.
Description
Regarding appearance, the Crab pattern appears similar to the Butterfly pattern. However, it has a long CD leg. Most of the time, this pattern is followed by a sharp and volatile price move. So, you need to anticipate higher volatility in your trade transaction at the completion point of the pattern.
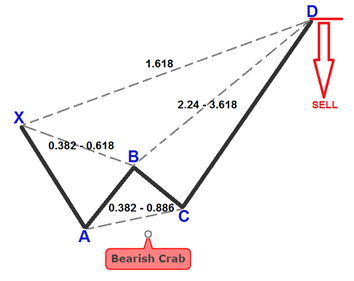
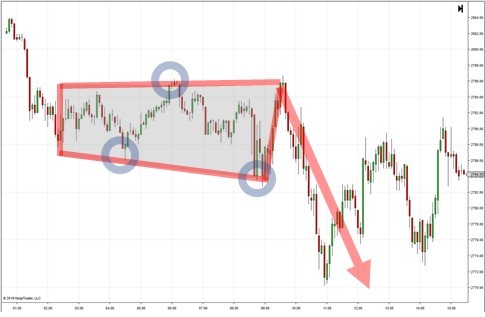
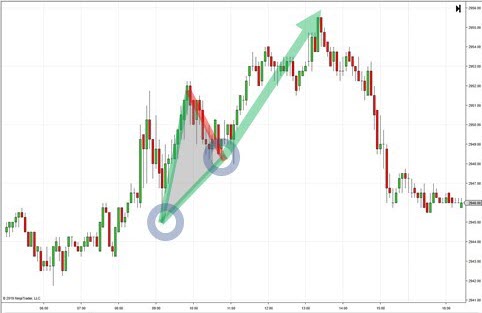
In the Crab, the stock price usually approaches the completion point very aggressively. The bearish Crab pattern signals a downward reversal in price while a bullish Crab pattern indicates an upward reversal in price.
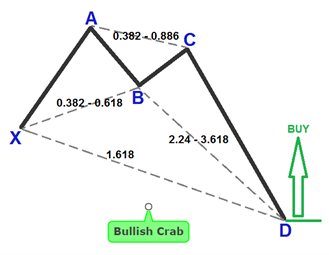
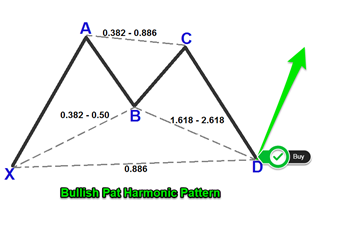
The images of the bullish and bearish versions of the Crab are given below:
General Rules for Trading in the Crab Pattern
- The B point of the Crab pattern ranges 0.382–0.618 retracement of the XA swing.
- BC needs to be 0.382–0.886 retracement of AB.
- CD needs to be 2.24–3.618 extension of BC.
- CD should also be equivalent to 1.618 extension of the XA leg. So, the D point is created by a 1.618 retracement of the XA leg and an extreme extension of the AB leg.
- D has to be a projection of a minimum of 2.24–3.618 to validate a Crab pattern.
Once the Crab is fully formed, traders can take their positions at or from point D, either at the high end or low end of the price at D. Note that 61.8% and 127.2% of the CD leg should be targeted. You can place your buy or sell order here.
The point where you place your profit target depends on the overall market scenario and your trading goals. If you want your profit target to be aggressive, consider placing it at point A but for a conservative profit target, you could place it at B.
Conclusion
This Crab is similar to the Butterfly pattern except that the final C-D leg has a deeper 161.8% extension of the initial X-A leg. The pattern generally requires a very small stop loss and the price is volatile in the Potential Reversal Zone. To trade in the Crab pattern, you want to enter the market with a long or short trade at D, at which point the stock price is expected to reverse direction.
There are certain challenges associated with the Crab pattern. For instance, it can be tough to memorize the Fibonacci retracement and extension values in a Harmonic Crab pattern. It can also be difficult to use the Fibonacci tool to measure each leg.
Therefore, it is important to have patience and wait for the proper retracements of the pattern. If the stock price does not touch the correct retracement or extension, it is advisable to not move your B or C points or the XA leg to fit them into a Crab. A hasty move could lead to trading an invalid Crab that could incur a loss in the long run.
Source Links:
http://indicatorvault.com/articles/crab–pattern–rules–trade–examples–forex/
https://learn.tradimo.com/advanced–chart–patterns/crab–pattern
https://www.mql5.com/en/blogs/post/50656
https://www.investoo.com/bearish–bullish–crab/
http://forextraininggroup.com/trade–crab–pattern–deep–crab–pattern/
http://www.profitf.com/articles/forex-education/harmonic-pattern-crab/
Browse Categories
Featured Posts
 3 years ago
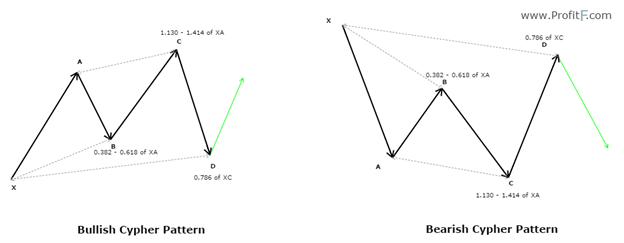
Cypher Pattern
3 years ago
Crab Pattern
 3 years ago
Butterfly Pattern
 3 years ago
Bat Pattern
 3 years ago
ABCD Pattern
 3 years ago
The Rectangle Pattern
 3 years ago
Triangle Patterns
 3 years ago
Flag Pattern
 3 years ago
Double and Triple Pattern
 3 years ago
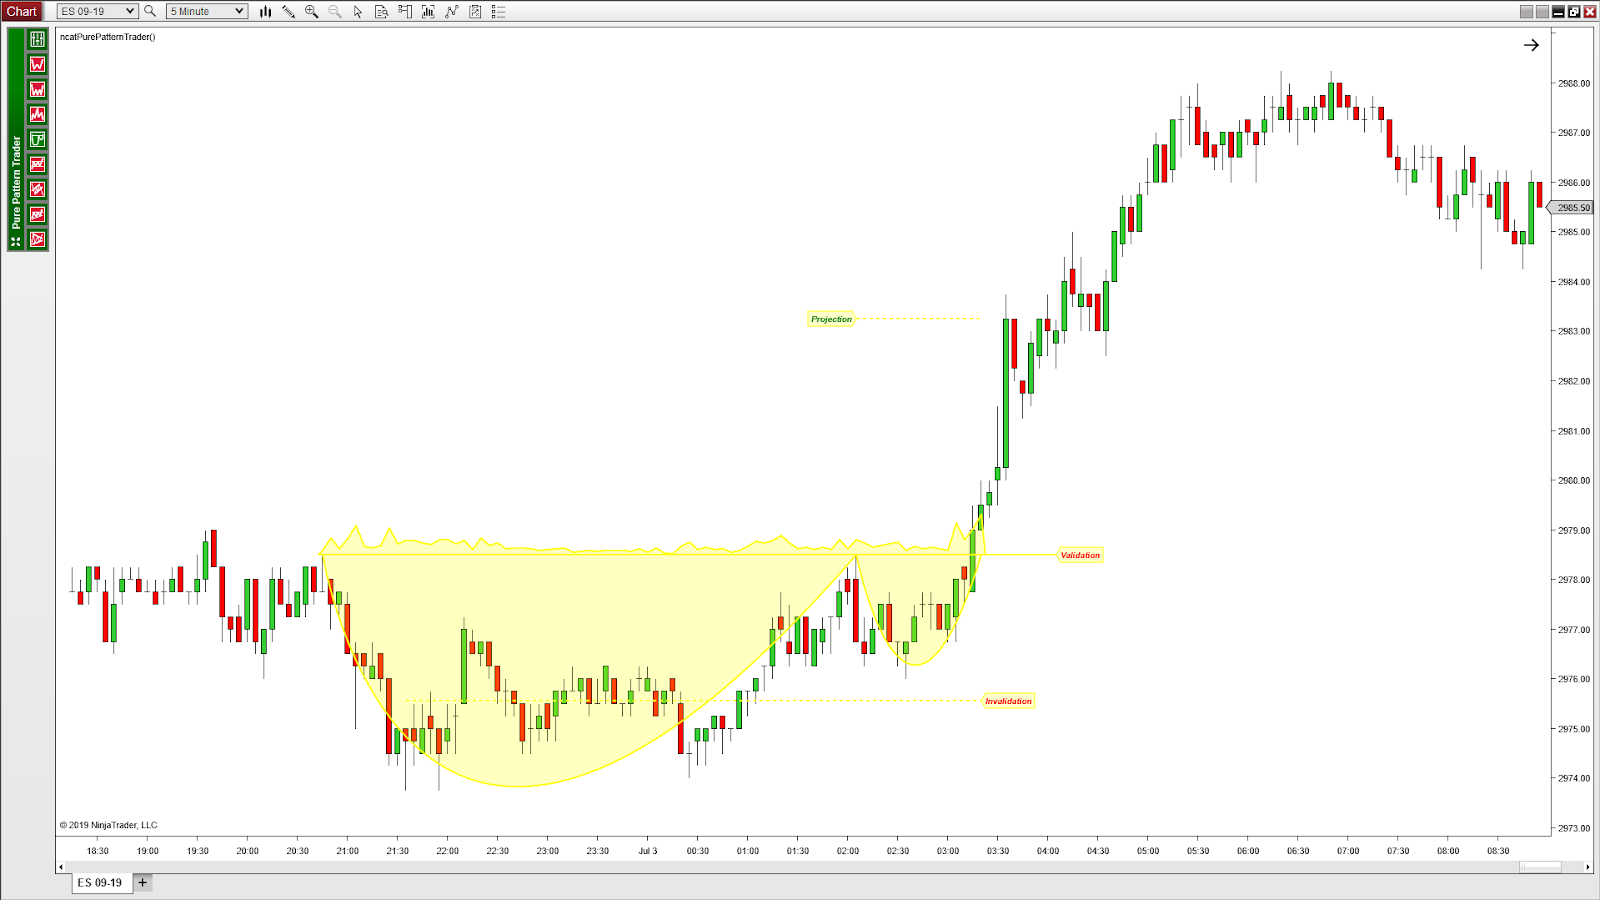
The Cup with Handle Pattern
 3 years ago
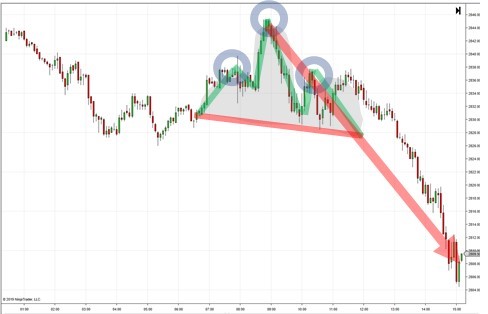
The Head-and-Shoulders Pattern
Popular Posts
Blockchain
3 years ago
The Cup with Handle Pattern
3 years agoRipple and Stellar
3 years ago