

-
3 years ago
-

0
-

Double and Triple Pattern
Introduction
Double and triple top/bottom patterns are generally used to get a thorough idea on how the current stock trend may shift over a particular course of time. The top formations occur in the uptrend whereas their counterparts take place in case of downtrend. However, identifying a particular money-making pattern through stock charts often can be tricky. Hence, it would be a smart ploy to have a look at these patterns in detail.
Detailed Analysis of The Patterns

Double Top Pattern
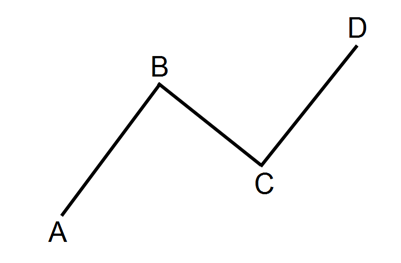
Fig: Double Top Pattern
Double top pattern ensues when the price starts to reach to a high point. In this pattern, a small trough is surrounded by two equal peaks. First, there is an extended move up, i.e. the market breaks through the resistance and thus the first top gets formed. Then it retraces back to the support level, and eventually rallies back to a similar high point forming the second top, and then declines to the neckline again. Basically, the neckline is a previous resistance area that later acts as support level. Once the market closes below the neckline, only then this pattern is confirmed.
Short sell hours:
- The price drops below the middle-trough.
Notable Facts:
- A decrease in price ranging from 10% to 20% from the first peak to the middle trough.
- Two peaks are supposed not to differ by more than 3% or 4%.
Setting up the target price:
For the double top pattern, buy shares at a target price of:
- (Entry price – the pattern’s height) i.e. distance from the trough to the top of the highest peak
Double Bottom Pattern

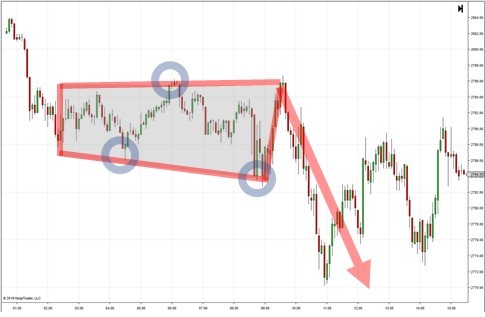
Fig: Double Bottom Pattern
In the Double bottom pattern, two successive bottoms are formed. Here, a small peak is surrounded by two equal troughs. This refers to approximately the same price level. In this pattern, a breakout will appear in case of an uptrend.
Purchase hours:
- The price exceeds the middle-peak price.
Notable facts:
- An increase in price ranging from 10% to 20% from the first trough to the middle peak.
- Two equal lows are supposed not to differ by more than 3% or 4%.
Setting up the target price:
For the double bottom pattern, it would be a good idea to sell the stock at a target price of:
- (Entry price + the pattern’s height) i.e. distance from the peak to the bottom of the lowest trough
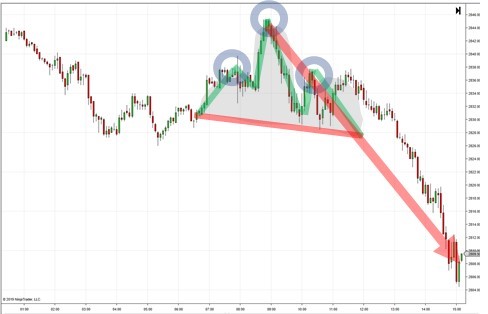
Triple Top Pattern
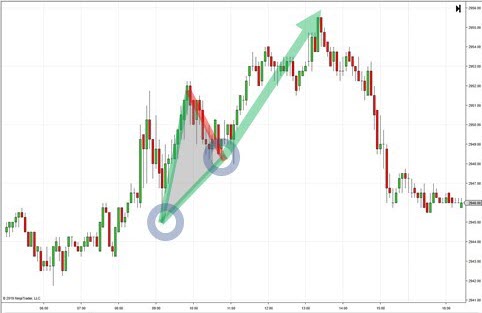
Fig: Triple Top Pattern
The triple top pattern is formed in the uptrend. In this pattern, three consecutive peaks are formed. This pattern is defined by three equal peaks amid a series of troughs. The peaks have roughly the unvarying price level. A breakdown below will result in the trend reversal.
This pattern formation is similar to the double top formation. However, three peaks are formed in the triple top pattern. The price keeps fluctuating between the support and resistance of these three peaks. The traders assume that stock is expensive. As a result, they sell stocks at the resistance levels. When the selling pressure is greater than the buying pressure, a breakdown takes place in triple top pattern. Thus, trend reversal happens after the breakdown.
Purchase hours:
- The price falls below the support that formed from the prior troughs.
Notable facts:
- A series of three peaks at relatively the same level.
Setting up the target price:
For triple top patterns, buy shares at a target price of:
- (Entry price – the pattern’s height) i.e. distance from the support to the top of the highest peak
Triple Bottom Pattern

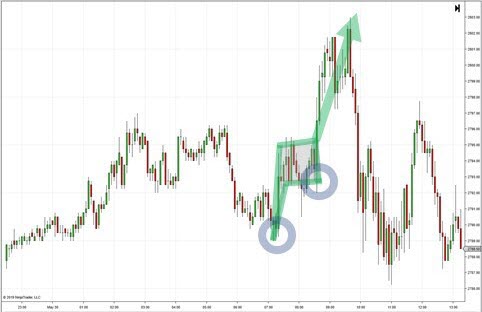
Fig: Triple Bottom Pattern
The triple bottom formation is developed in the downtrend. In this pattern, three consecutive bottoms are formed and three equal troughs remain amid a series of peaks. The bottoms stay almost at the same price level. A breakout will result in the trend reversal.
In this case, investors and hedge funds think that there is a possible trend reversal. They think the stock is oversold. The buying activity gets initiated and the price fluctuates between support and resistance. Whenever the downward pattern gets directed to a level of support, subsequently it tends to move back to a level of resistance. When the stock’s buying pressure overwhelms the selling pressure, the triple bottom pattern breakout happens and the uptrend begins.
Purchase hours:
- The price exceeds the resistance established by the prior peaks.
Notable facts:
- A series of three identical troughs at the end of a prolonged downtrend.
Setting up the target price:
For triple bottom patterns, sell your stock at a target price of:
- (Entry price + the pattern’s height) i.e. distance from the resistance to the bottom of the lowest trough
Conclusion
Pattern concept involves predicting future price movements for stocks, currency, bonds and commodities. Using historical market data, mass investor psychology can be analyzed effectively. Through this, investors get a good idea on when to buy or sell stocks on bounces. Such analysis comes quite handy for investors in terms of trend identification.
Reference links:
https://www.investopedia.com/university/charts/charts9.asp
http://marketrealist.com/2014/11/must-know-different-types-reversal-patterns-part-c/
https://www.thebalance.com/trading-double-top-triple-top-reversal-chart-patterns-1031469
https://www.accendomarkets.com/research/education/double-triple-tops-bottoms/
https://www.investorsunderground.com/stock-chart-patterns/double-triple-bottoms-tops/
Browse Categories
Featured Posts
 3 years ago
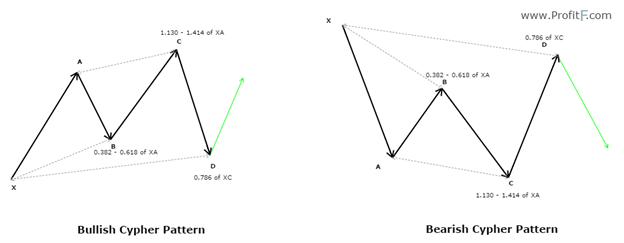
Cypher Pattern
 3 years ago
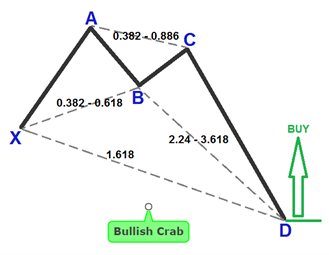
Crab Pattern
 3 years ago
Butterfly Pattern
 3 years ago
Bat Pattern
 3 years ago
ABCD Pattern
 3 years ago
The Rectangle Pattern
 3 years ago
Triangle Patterns
 3 years ago
Flag Pattern
3 years ago
Double and Triple Pattern
 3 years ago
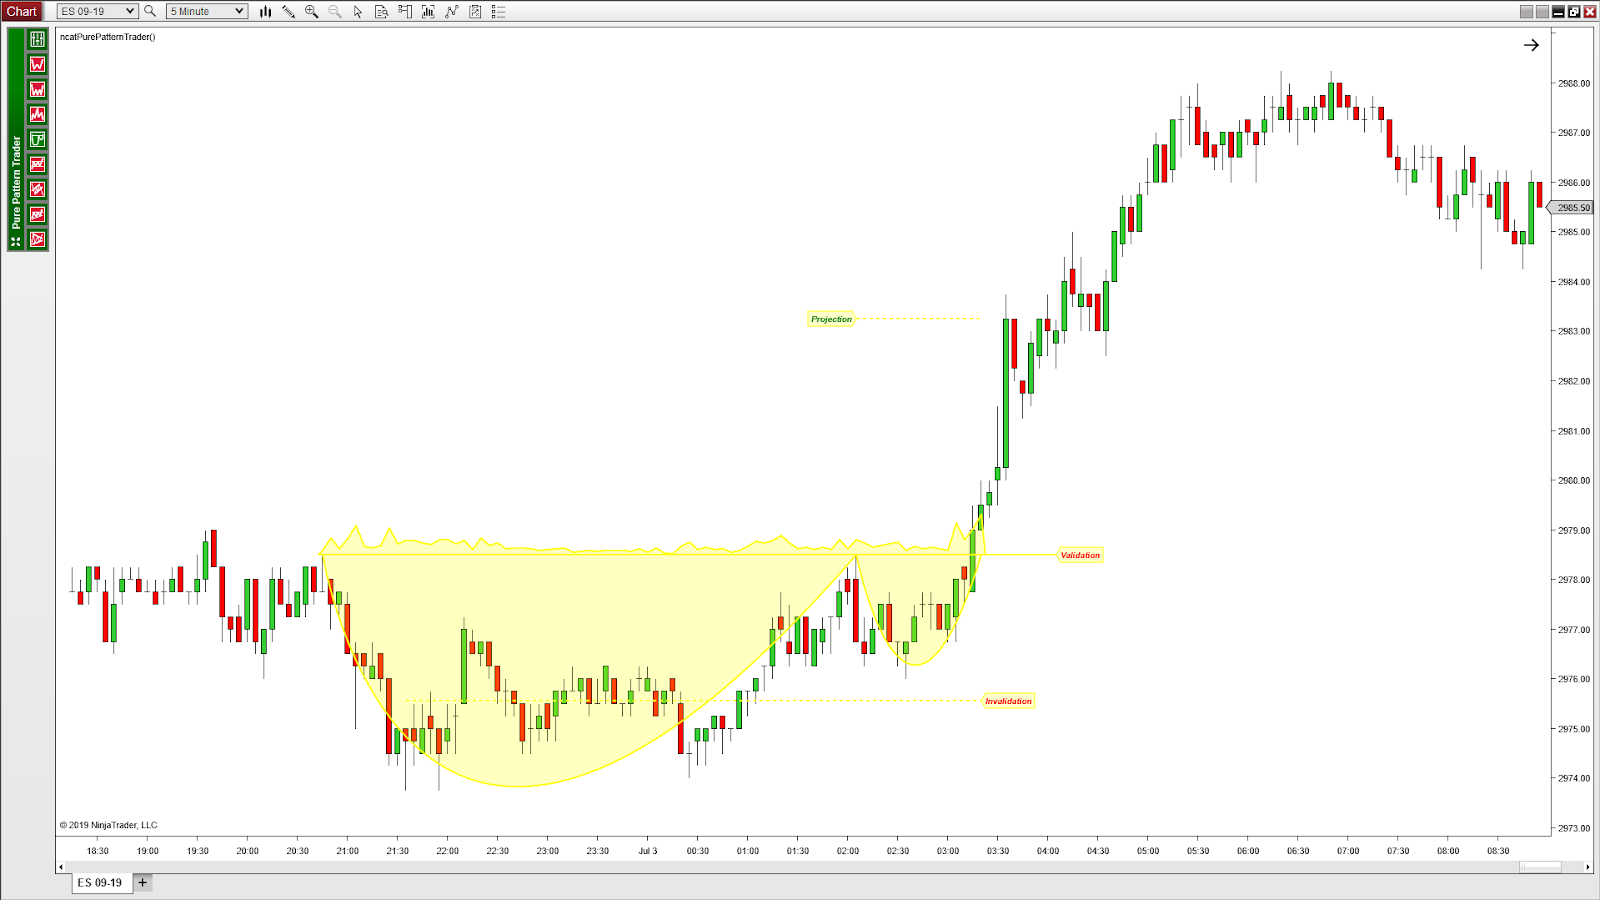
The Cup with Handle Pattern
 3 years ago
The Head-and-Shoulders Pattern
Popular Posts
Blockchain
3 years ago
The Cup with Handle Pattern
3 years agoRipple and Stellar
3 years ago