
-
3 years ago
-

0
-

Elliott Wave Theory
What is the Elliott Wave Theory?
The Elliott Wave Theory is a method of market analysis. It is based on the concept that the market shows the same types of patterns on a smaller timeframe (lesser degree) as well as a longer timeframe (higher degree). Such patterns successfully predict as to what might happen next in the market. The theory holds that irrespective of what timeframe you are analyzing, the stock price in the market follows the same types of patterns.
In stock market trading, the Elliott Wave Theory posits that crowd behavior has clear trends in the way it ebbs and flows. On the basis of this ebb and flow, Ralph Nelson Elliott presented a certain structure to price movements in the financial markets.
Who Developed the Elliott Wave Theory?
It was Ralph Nelson Elliott who developed the Elliott Wave Theory or more accurately Elliott Wave Principle in the late 1920s. During the early 1940s, this theory continued to develop. Elliott connected the patterns of collective human behavior to the Fibonacci or “golden” ratio. The Fibonacci is a mathematical phenomenon that is well–known as one of nature’s universal laws of form and progress.
In the 1970s, this wave theory became popular, thanks to the Frost and Prechter’s famous book The Elliott Wave Principle – The Key to Stock Market Profits. In this work, the authors predicted the bull market of the 1970s and Robert Prechter made a forecast of the crash of 1987.
The Basic Premise of Elliott Wave Theory
Elliott stated that market cycles were a result of investors’ reactions to external influences or the dominant mass psychology at that point of time. He observed that the upward and downward swings of mass psychology had a repetitive pattern.
Fractal Nature
Elliott’s theory is somewhat based on the Dow theory, according to which the stock price moves in waves. Owing to the “fractal” nature of markets, Elliott was able to analyze them more extensively. Fractals are mathematical structures that keep repeating themselves infinitely on an ever–smaller scale. It means that the minute is the same as the GrandSuper Cycle. Elliott saw that the patterns that appeared in higher degrees of trend repeated themselves on lower degrees of trends as well.
In fact, Elliott held that man’s activities, not simply those confined to the stock market, are influenced by an identifiable series of waves.
Sequence of Waves
There are two types of waves: impulse and corrective.
Impulse waves tend to move in the direction of the larger degree wave. When the larger degree wave is up, the advancing waves are impulsive while declining waves are corrective. When the larger degree wave is down, impulse waves are down as well, and the corrective waves are up. Thus, impulse waves, which are also called motive waves, move with the larger degree wave or the bigger trend. Corrective waves, however, move against the larger degree wave.
Impulse Waves
The impulse pattern comprises five waves. These waves can be in an upward or downward direction.
The first wave is generally a weak rally with the participation of only a small percentage of traders. Once Wave 1 is over, Wave 2 comes as a vicious sell–off wave. Wave 2 finally ends without making any new lows and the market begins to turn around for another rally. When Wave 3 starts, it is initially slow but finally reaches the top of the previous rally. There are many stops above Wave 1 at this time. As soon as the stock price exceeds the Wave 1 high, the stops are removed and the Wave 3 rally catches the attention of traders. The traders who were upset for a while decide that the trend is moving upwards, and they decide to buy stock. All this interest fuels the Wave 3 rally. This is the time when most of the traders have decided that the trend is up.
When all the frenzy for buying dies down, Wave 3 comes to an end. Traders who were long from the lows now decide to take profits. This leads to Wave 4, which marks a pullback in the stock price. Where Wave 2 was a vicious sell–off, Wave 4 seems to be an orderly profit–taking decline. The majority of the traders consider this profit–taking decline to be a great time to buy stock and get even. At the end of Wave 4, more buying occurs and the price begins to rally again.
The Wave 5 rally does not have the amount of enthusiasm found in the Wave 3 rally. The Wave 5 advance is caused by a merely small group of traders. Finally, when this lackluster buying interest dies out, the market enters a new phase.

Corrective Waves
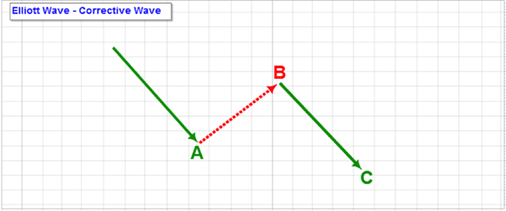
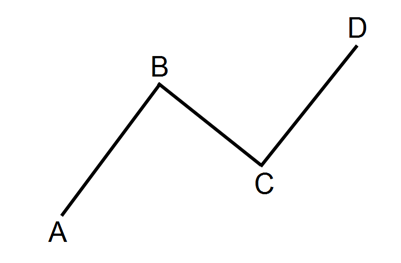
The corrective wave structure is typically depicted as a three–wave structure as seen in the above chart. Its sub–waves are labelled waves A, B and C. This can be misleading since not all corrective waves are exactly three–wave structures. Though not all corrective waves are exactly three–wave structures, let us consider that they have three sub–waves.
As seen in the chart, both Wave A and Wave C are in the direction of the trend of a higher degree, which in this case, is the direction of the correction. Wave B is moving against the direction of the larger correction or the trend of one higher degree.
Types of Corrective Patterns
Often, Elliott traders make money during an impulse pattern but then lose it during the corrective pattern. There are two types of corrective waves – simple correction and complex corrections.
- Simple Correction (Zig–Zag)
There is only one pattern in a simple correction called the Zig–Zag. It has three waves, with Wave B not retracing more than 75% of Wave A. Wave C will dip to new lows below the end of Wave A. Notably, Wave A of a Zig–Zag correction always has a five–wave pattern.

- Complex Corrections
Complex corrections consist of three patterns:
- Flat Correction
In this correction, the length of each wave is identical. Following a five–wave impulse pattern, the stock price shows a drop in Wave A. It then rallies in Wave B to the previous high. Finally, the price dips again in Wave C to the previous Wave A low.

2. Irregular Correction
Wave B makes a new high in this correction. The final Wave C may fall towards the beginning of Wave A, or below it.

3. Triangle Correction
The Triangle pattern appears time and again. The five sub–waves of the triangle are A, B, C, D and E in sequence.
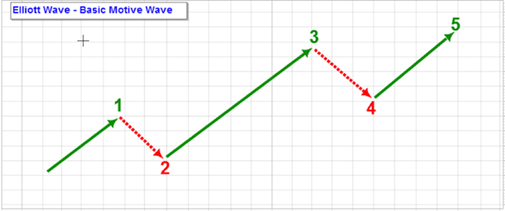
The Elliott Wave Pattern
The Impulse Wave or Motive Wave is the first part of an ideal Elliott Wave pattern. It generally advances in the direction of one larger degree trend and is subdivided into five smaller waves. These waves are named 1, 2, 3, 4 and 5, as shown in the chart below.
3 Rules for Impulse Wave Formation
There are three rules for Impulse Wave formation that must be satisfied:
- Wave 2 is always seen to retrace less than 100% of Wave 1.
- Wave 4 is always seen to retrace less than 100% of Wave 3.
- Wave 3 always moves beyond the end of Wave 1 and is generally never the shortest wave.
Basic Cycle Structure of Elliott Wave
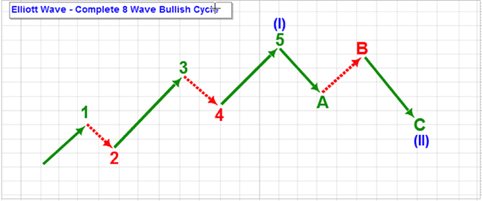
The complete Elliott Wave cycle consists of the combination of a motive/impulse wave and a corrective wave. This is shown as an eight wave–structure. First, there is a five–wave advance (motive wave) in the direction of the trend of one larger degree. This is followed by a three–wave correction that moves against the higher degree trend.
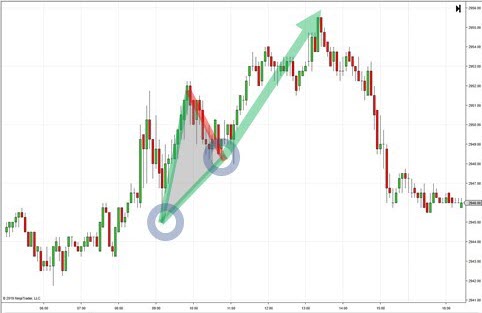
In a bullish cycle, the chart shows a sequence of eight waves, which has a rising five–wave motive wave and a falling three–wave correction. This movement from the beginning to end ends at a higher point, indicating an increase in price. Notably, a 5–3 structure is the minimum requirement to get progress and fluctuation in an up or down direction.
Elliott observed that there was a repetition of the 5–3 structure over and over again. This formed the basis of the general Elliott Wave cycle structure.
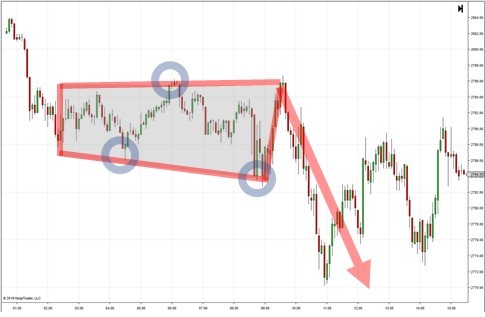
When the stock price falls, the pattern moves downwards and corrects higher. So, there is a five–wave down sequence after which comes a three–wave up sequence.
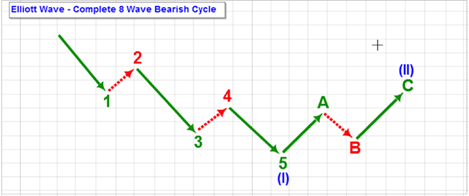
In a declining market, as shown above, there is an eight–wave structure. The stock price ends at a lower point than where it started.
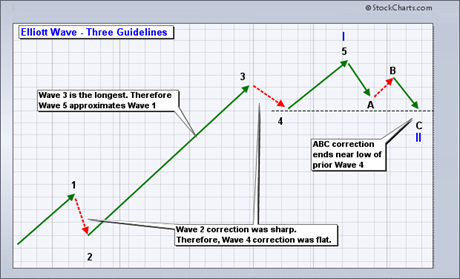
Main Guidelines
- In cases where Wave 3 is the longest impulse wave, Wave 5 will approximately be equal to Wave 1.
- Wave 2 and Wave 4 will always alternate. When Wave 2 is a sharp correction, Wave 4 will be a flat correction. Similarly, if Wave 2 is flat, Wave 4 will be sharp.
- Following a 5–wave impulse advance movement, corrections generally end near the low of prior Wave 4.
Conclusion
The Elliott Wave theory is not any trading technique. There are neither any particular rules of entry and exit nor any “right” way to use it in trading. Owing to this, the Elliott Wave is avoided by many traders and technical analysts. The subjective nature of the Elliott Wave and its application requires judicious decision–making. Nevertheless, Elliott Wave patterns have been successfully used by many, both professional traders and individual investors. Advocates tend to use various indicators to help them trade specific Elliott Wave patterns.
Source Links:
https://www.elliottwave.com/Free–Reports/Introduction–to–the–Wave–Principle
http://stockcharts.com/school/doku.php?id=chart_school:market_analysis:elliott_wave_theory
http://www.tradersedgeindia.com/elliott_wave_theory.htm
Browse Categories
Featured Posts
 3 years ago
Cypher Pattern
 3 years ago
Crab Pattern
 3 years ago
Butterfly Pattern
 3 years ago
Bat Pattern
 3 years ago
ABCD Pattern
 3 years ago
The Rectangle Pattern
 3 years ago
Triangle Patterns
 3 years ago
Flag Pattern
 3 years ago
Double and Triple Pattern
 3 years ago
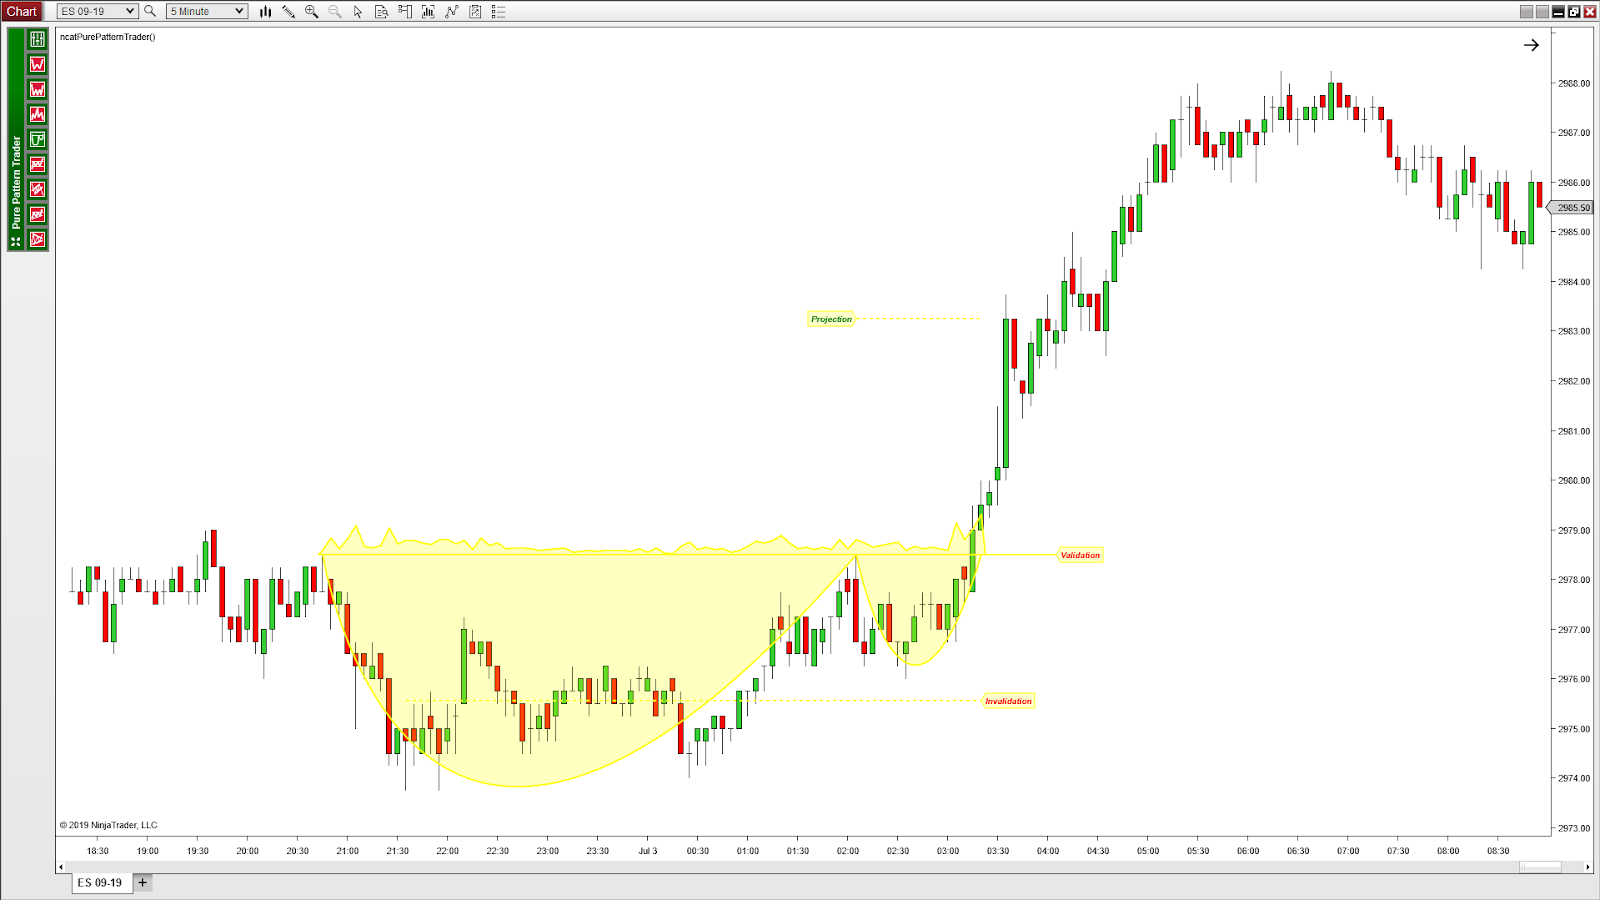
The Cup with Handle Pattern
 3 years ago
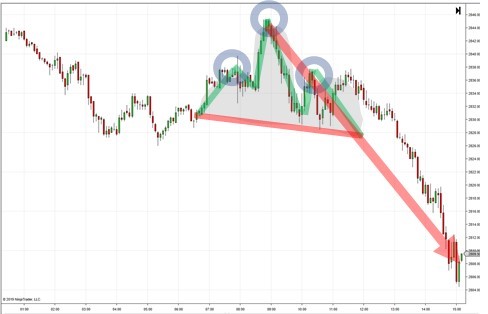
The Head-and-Shoulders Pattern
Popular Posts
Blockchain
3 years ago
The Cup with Handle Pattern
3 years agoRipple and Stellar
3 years ago