
-
3 years ago
-

0
-

Five O (or 5-0) Pattern
Introduction
The 5–0 pattern, though comparatively new, is emerging to be more popular. It was discovered by Scot Carney and is a distinct 5–point reversal structure. The pattern has 4 legs and specific Fibonacci measurements of each point within its structure, which omits the room for flexible interpretation. Essentially, it helps stock traders take advantage of key reversals in the price chart by finding a unique entry point.
Description
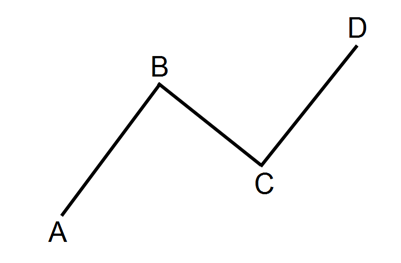
The pattern begins with either an uptrend or a downtrend which when it exhausts itself, forms corrective, zigzag movements.
General Rules
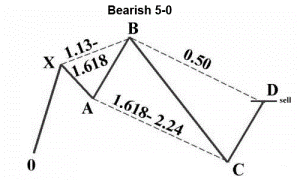
The 5–0 pattern has bullish and bearish versions. These are as given below:
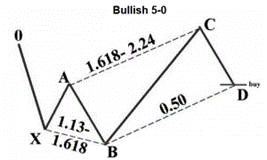
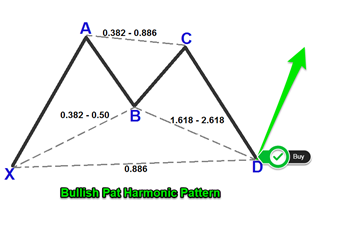
- The first requirement for the pattern is a new low that is greater than the previous low (points B and X).
- The AB leg needs to be a 1.130–1.618 extension of XA.
- BC should be 1.618–2.240 extension of AB. This tight range is a defining element of the structure. You need to note that the BC leg is the longest price length of the structure. However, it must not exceed 2.24.
- The XA projection that defines point B should not exceed 1.618. This is because any extension greater than 1.618 will negate the structure, as smaller impulse moves are more preferable.
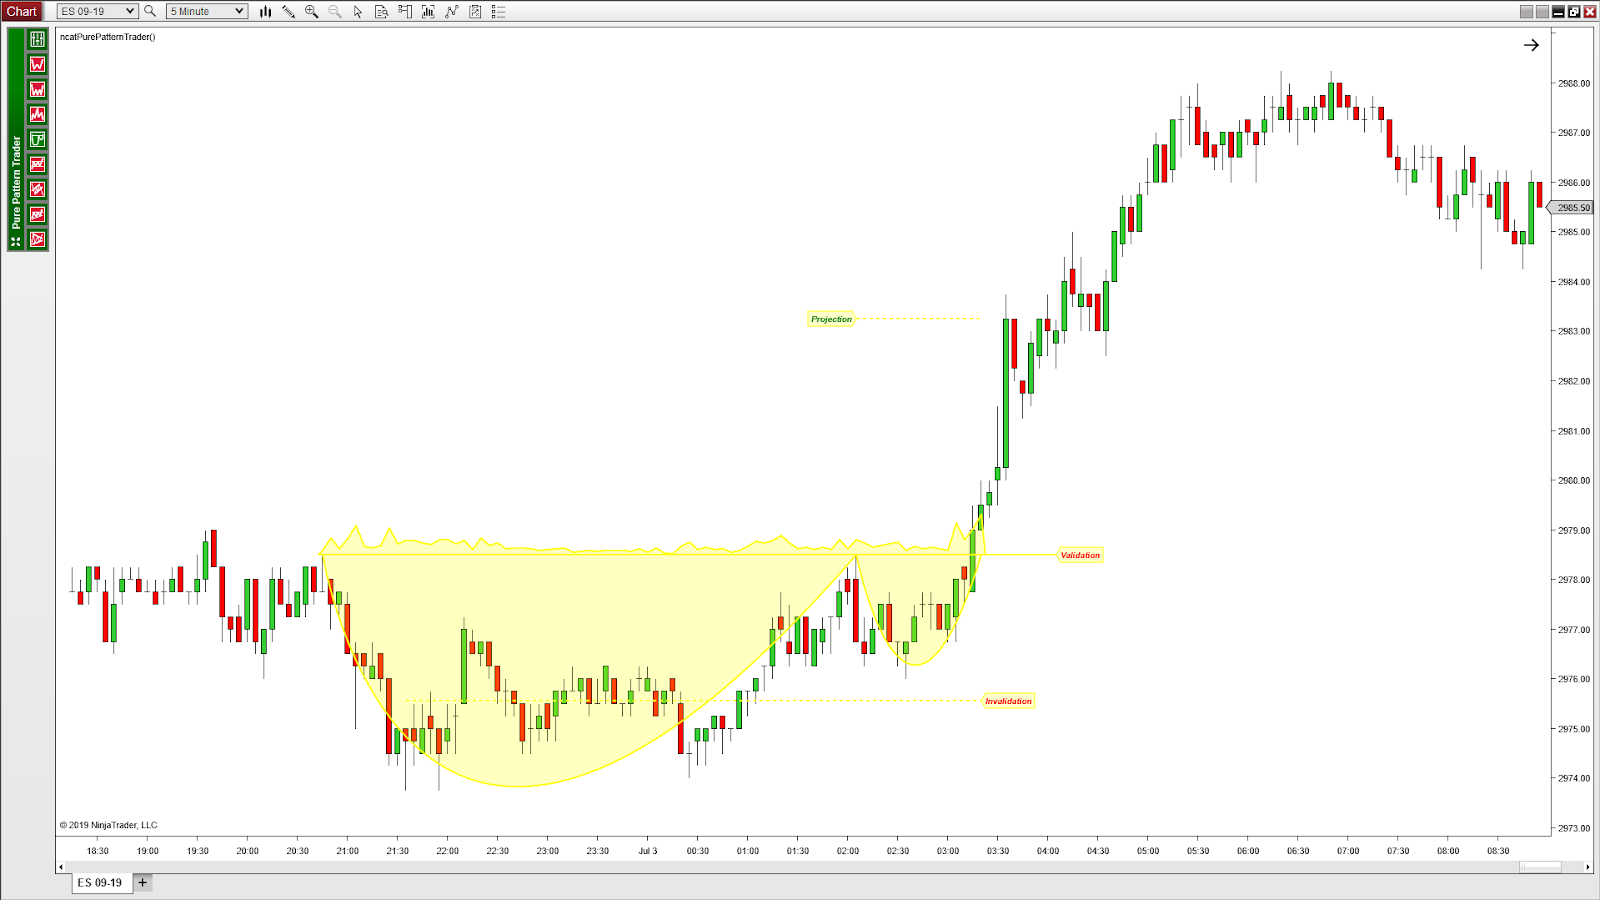
- Once the BC leg has reversed, the 50% retracement is measured from point B to point C. Additionally, the reciprocal AB=CD is projected from point C and has to be equal in length to AB to complement the Potential Reversal Zone (PRZ).
- Point D should be around 0.500 retracement of the BC leg. This essentially forms the PRZ of the pattern. You need to check that CD includes a reciprocal AB=CD pattern. This makes the PRZ of this pattern different from other harmonic patterns.
- The completion of CD will determine your buying or selling zone, depending on the bullish or bearish patterns of the 5–0.
- The target can be placed at your discretion as the reversal point could mark the beginning of a new trend. The most common stop levels are generally beyond point D or the next key level for the Fibonacci sequence.
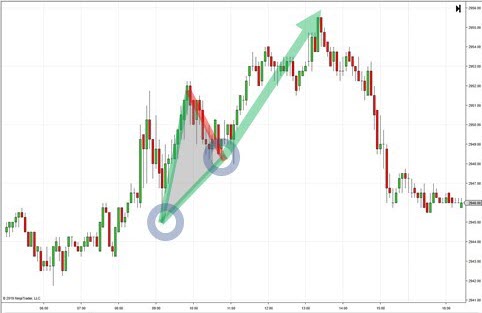
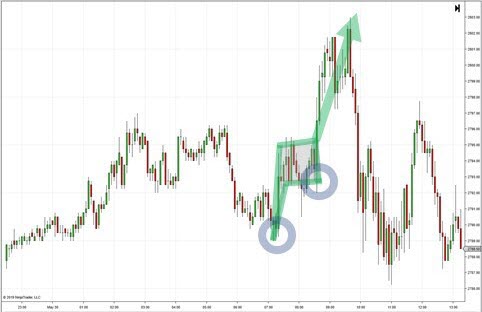
For the bullish pattern, you want to first identify a bearish fall in the stock price which is the 0X leg. It is this leg that creates the setup of the pattern. Then, you want to find a higher retracement, namely the XA leg, which forms the start of the pattern. The price then falls from here to a new low below the X0 low, which gives the AB leg.
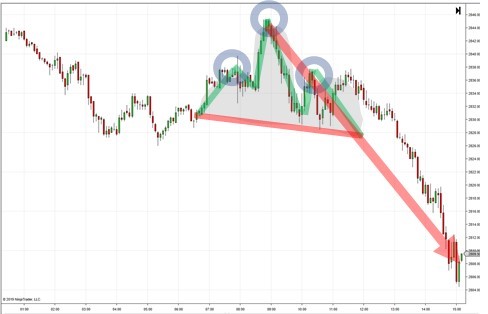
For the bearish pattern, you want to initially note a bullish price move, which leads to the setup of the pattern and creates the OX leg. From here, the stock price retraces lower to give you the XA leg. From this point, the price will then reverse and move upwards again to put a new high above the XA high, producing the AB leg.
Conclusion
In the evolution of harmonic trading, the 5–0 pattern marks the next step. Although this pattern shares many similarities with other harmonic patterns, there are several unique characteristics that set this structure apart. It is quite an effective pattern, but you have to be strict in the application of rules to reap profits out of it. It is an excellent pattern for picking out reversals in the stock price.
Source Links:
https://www.tradingview.com/ideas/5–0pattern/
https://www.tradingview.com/chart/EURNZD/QVJaBrry–This–is–How–the–5–0–Pattern–Looks–Like–forex/
https://www.orbex.com/blog/2017/03/catch–key–reversals–5–0–pattern
http://strategy4forex.com/trading–on–the–forex–graphical–models–and–patterns/pattern–5–0.html
http://konn7.com/fx/The5–0Pattern.pdf
http://www.autochartpatterns.com/shark–5–0–patterns/
Browse Categories
Featured Posts
 3 years ago
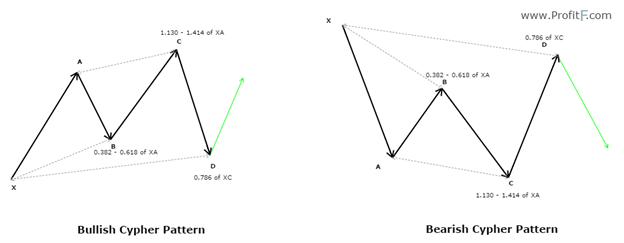
Cypher Pattern
 3 years ago
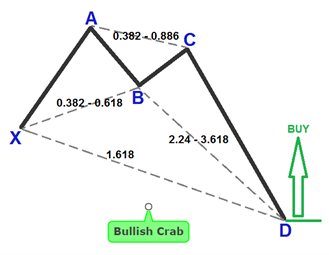
Crab Pattern
 3 years ago
Butterfly Pattern
 3 years ago
Bat Pattern
 3 years ago
ABCD Pattern
 3 years ago
The Rectangle Pattern
 3 years ago
Triangle Patterns
 3 years ago
Flag Pattern
 3 years ago
Double and Triple Pattern
 3 years ago
The Cup with Handle Pattern
 3 years ago
The Head-and-Shoulders Pattern
Popular Posts
Cryptomining
3 years ago