
-
3 years ago
-

0
-

Flag Pattern
Introduction
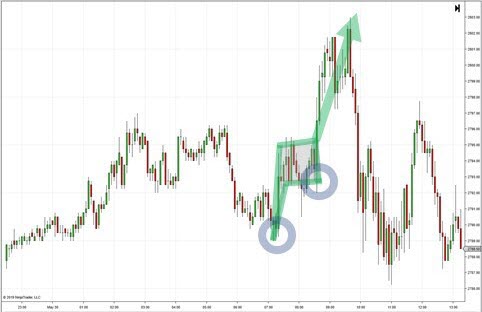
Flags are chart patterns formed by price action, which is shown within a small rectangle or a parallelogram. These are typically small, indicating comparatively small risk and quick profits. When the market consolidates in a narrow range after a sharp move, a flag chart pattern is formed.
A flag is usually preceded by a sharp rise or fall with heavy volume, and it is positioned at a midpoint of the move. Therefore, the flag is a continuation pattern.
The pattern has the appearance of a “flag” since the small rectangle representing the consolidation is connected to the pole (the large, swift move).
Description of the Pattern
A flag needs to have the following specifications to qualify for the pattern:
Sharp Move
The move which precedes the flag portion of the pattern, that is, the pole, needs to be sharp or vertical. Notably, it should be swifter and larger than the recent price moves before it. Flags generally occur on heavy volume and may contain gaps. The prior move usually represents the first leg of a significant rise or fall and the flag is merely a pause.
Flagpole
The flagpole is the distance between the first resistance or support break and the high or low of the flag. The sharp rise or fall that forms the flagpole needs to break a trend line or resistance/support level. It is essentially the line that extends up from this break to the highest point of the flag that forms the flagpole.
The flagpole shows a trend impulse on the chart. Since every trending move could become a flag, every trend impulse could well appear to be a flagpole. When a flag pattern is emerging, the large impulse move or flagpole is noted first. It is then followed by a brief consolidation, which takes on the formation of a flag.
Flag
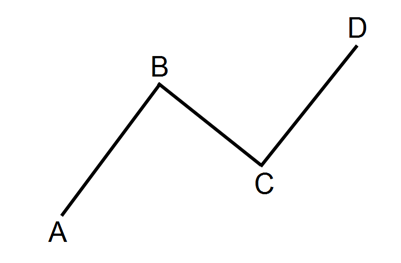
A flag comprises a small rectangle pattern that slopes against the previous trend. If the previous move was up, the flag goes down. If the move was down, then the flag shows a rise. Flags generally have too short a duration to actually have reaction highs and reaction lows. Hence, the price action needs to be contained within two parallel trend lines.
Post creation of the pole, in a flag pattern, the stock trades within a tight range and takes the shape of a flag. The price movement in a flag has evenly distributed tops and bottoms. Simultaneously, this price movement has a corrective character on the graph. In such a manner, it is angled contrary to the trend impulse that creates the flagpole.
Conclusion
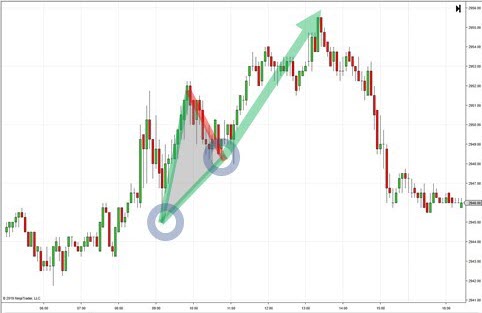
The flag pattern is a popular continuation pattern. A valid flag is likely to drive the price further in the direction of the flag pole.
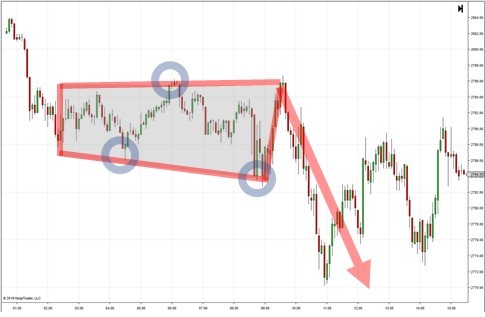
The flag can be slanted upwards, downwards or sideways. Flags in the same direction as the preceding move deteriorates the performance of the pattern. Ideally, there is a sharp move upwards followed by a flag that slopes slightly downwards. If the sharp move is downwards, you want to trade a flag that moves sideways or higher.
Typically, flags take less time to form at the time of downtrends compared to uptrends. They are short–term patterns that last for 1–3 weeks, but can be formed over longer periods as well.
Reference Links:
https://www.investopedia.com/university/charts/charts6.asp
https://www.thebalance.com/how–to–trade–the–flag–chart–pattern–1031467
http://www.stock–trading–infocentre.com/flag–patterns.html
https://tradingsim.com/blog/flags–and–pennants/
http://forextraininggroup.com/trade–bearish–bullish–flag–patterns–like–pro/
Browse Categories
Featured Posts
 3 years ago
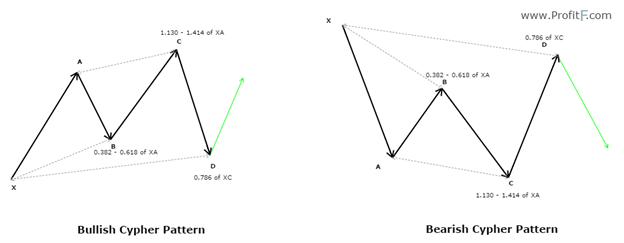
Cypher Pattern
 3 years ago
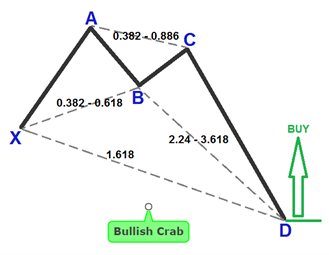
Crab Pattern
 3 years ago
Butterfly Pattern
 3 years ago
Bat Pattern
 3 years ago
ABCD Pattern
 3 years ago
The Rectangle Pattern
 3 years ago
Triangle Patterns
3 years ago
Flag Pattern
 3 years ago
Double and Triple Pattern
 3 years ago
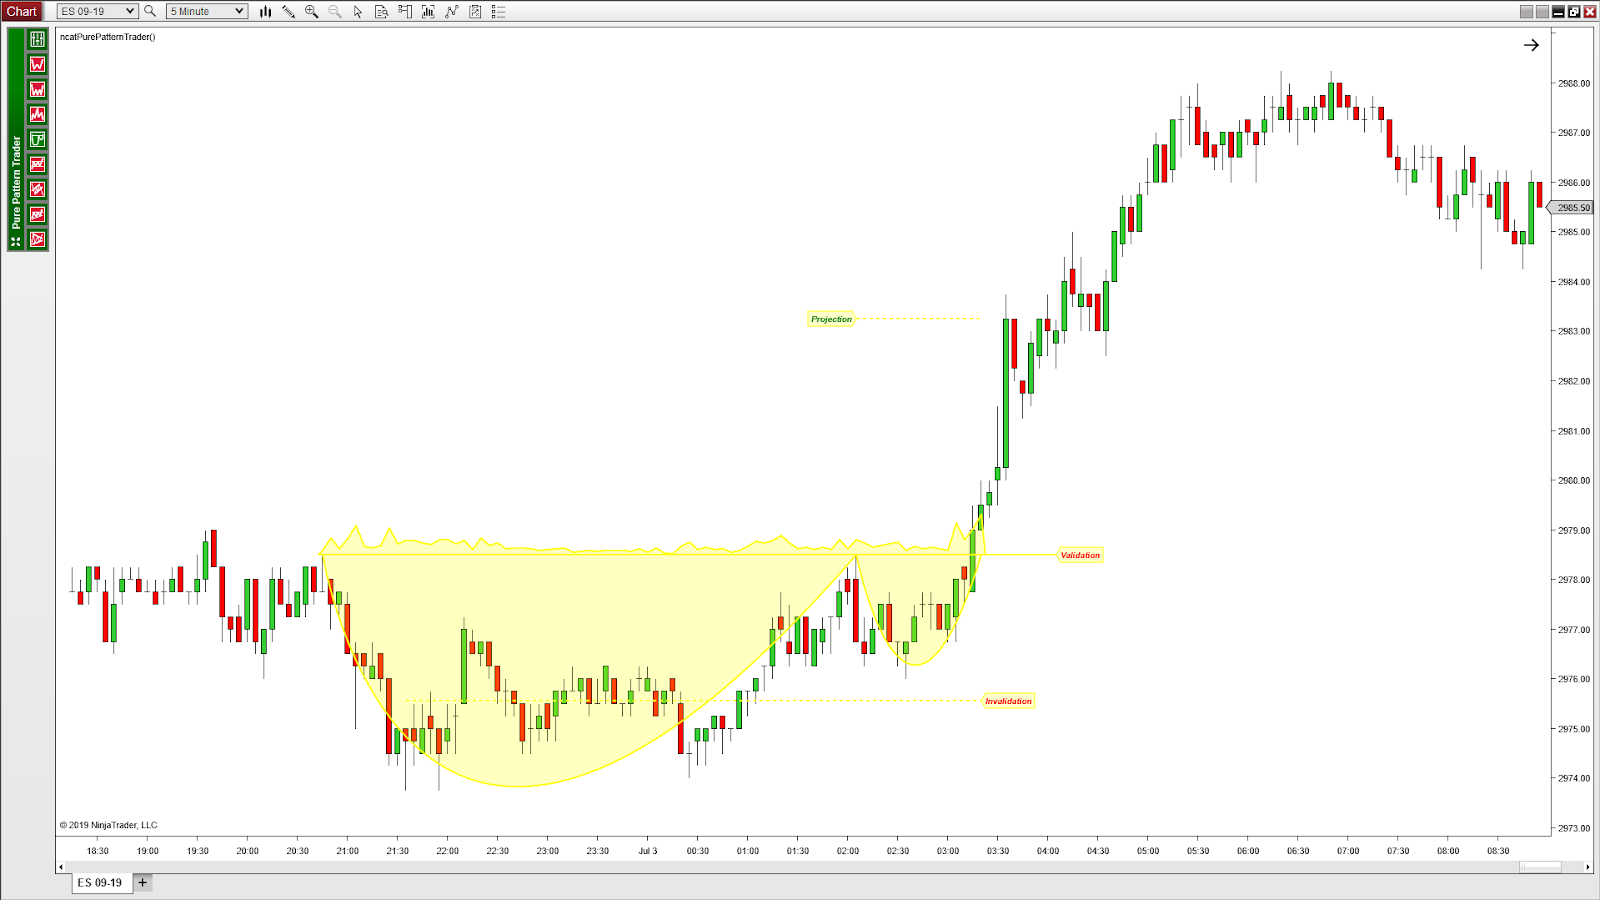
The Cup with Handle Pattern
 3 years ago
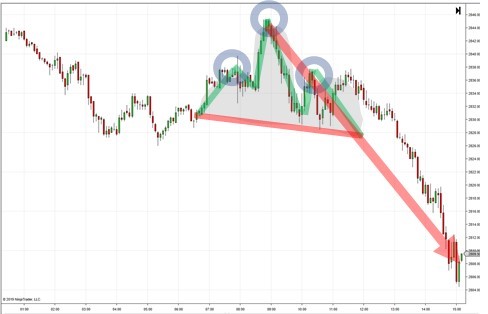
The Head-and-Shoulders Pattern
Popular Posts
Cryptomining
3 years ago