
-
3 years ago
-

0
-

Gartley Pattern
Introduction
The Gartley pattern forms when a trend temporarily reverses direction before returning to its original course. Basically a retracement and continuation pattern, it is one of the most traded harmonic patterns. This pattern is named after Harold McKinley Gartley, who in the mid-1930s had a stock market advisory service with a large following.
The Gartley is a complex price pattern founded on Fibonacci numbers or ratios. It is used to determine buy and sell signals by measuring price retracements of the upward and downward movements in stock price.
The pattern gives you a low risk opportunity to enter the market where it completes and the trend resumes. The Gartley “222” pattern is named for the page number on which it is found in Gartley’s book Profits in the Stock Market.
Description
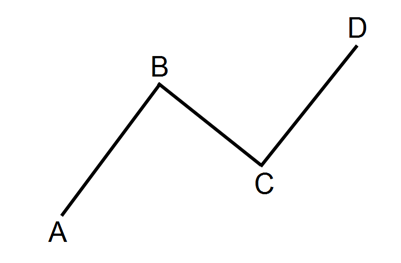
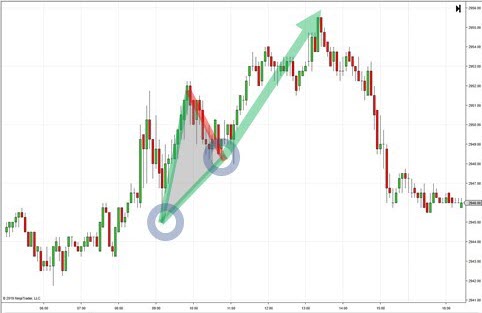
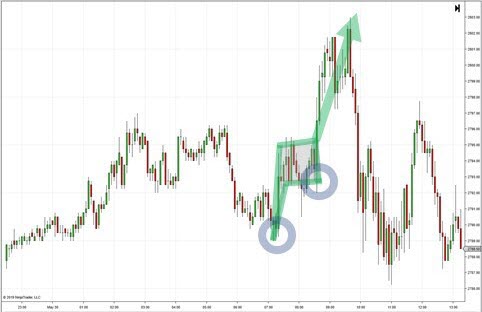
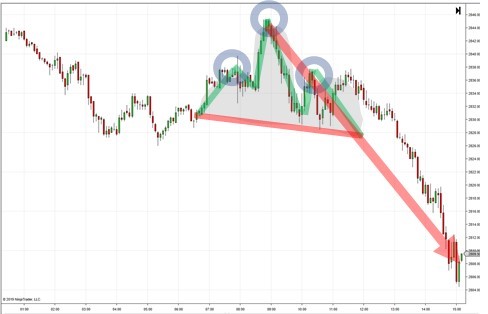
A Gartley contains the basic ABCD pattern but is preceded by a considerable high or low. This pattern generally forms when a correction of the overall trend occurs. In appearance, it looks like the letter ‘M’ for bullish patterns and ‘W’ for bearish patterns.
This pattern is used to help traders find favourable positions to enter in the overall trend. A Gartley pattern forms when the stock price has been on a recent uptrend or downtrend but has begun to show signs of a correction. In this setup, the reversal points are a Fibonacci retracement and Fibonacci extension. This is a greater indication that the pair could reverse.
General Rules of Trading in the Gartley Pattern
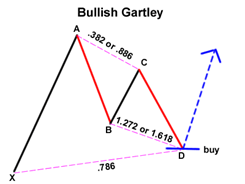
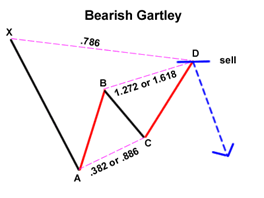
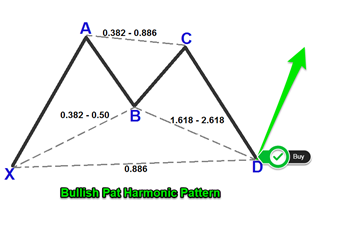
The AB leg should be the .618 retracement of XA.
The BC leg needs to be either .382 or .886 retracement of AB.
If the retracement of the BC leg is .382 of AB, CD should be 1.272 of BC. Consequently, if the BC leg is .886 of AB, then CD should extend 1.618 of BC.
CD should be .786 retracement of the XA leg.
This pattern is difficult to identify and can be confusing as well. You need to take one step at a time to avoid confusion.
The Gartley pattern contains a bullish or bearish ABCD, but is preceded by a point X that is beyond point D. You want to identify where the pattern will complete at point D, which will be 78.6% retracement of XA. Place a buy or sell order here. Position your stop loss just below point X.
The point at which you place your profit target depends on the market scenario and your trading objectives. One method is drawing a new Fibonacci retracement from point A to D of the completed Gartley. Once this Fibonacci retracement has been drawn, you want to place your profit target at the 61.8% retracement level of AD.
Conclusion
The Gartley pattern, therefore, includes the ABCD pattern in its structure. It gives the trader the opportunity to go long in the case of a bullish Gartley or short in the case of a bearish Gartley at the point where the trend resumes on completion of the pattern.
It depends on Fibonacci levels, which mark how far the stock price retraces or extends during the pattern formation. Described by Gartley as “one of the best trading opportunities” in the market, it is a special chart pattern in the world of harmonic patterns. When traded properly, the Gartley pattern provides a high reward to risk ratio.
Source Links:
https://www.investopedia.com/terms/f/fibonacciretracement.asp
https://www.babypips.com/learn/forex/the-gartley-and-the-animals
https://learn.tradimo.com/advanced-chart-patterns/gartley-pattern
http://forextraininggroup.com/trading-the-gartley-pattern-ratios-rules-and-best-practices/
Browse Categories
Featured Posts
 3 years ago
Cypher Pattern
 3 years ago
Crab Pattern
 3 years ago
Butterfly Pattern
 3 years ago
Bat Pattern
 3 years ago
ABCD Pattern
 3 years ago
The Rectangle Pattern
 3 years ago
Triangle Patterns
 3 years ago
Flag Pattern
 3 years ago
Double and Triple Pattern
 3 years ago
The Cup with Handle Pattern
 3 years ago
The Head-and-Shoulders Pattern
Popular Posts
Blockchain
3 years ago
The Cup with Handle Pattern
3 years agoRipple and Stellar
3 years ago