
-
3 years ago
-

0
-

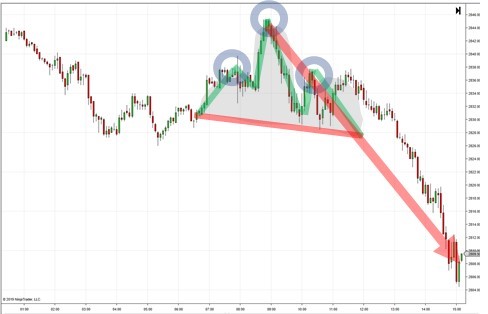
The Head-and-Shoulders Pattern
Introduction
The head-and-shoulders pattern refers to a specific chart formation which predicts a bullish–to–bearish trend reversal. It is held to be one of the most dependable trend reversal patterns. Notably, it is one of the top patterns that indicates that an upward trend is nearing its end.
As is obvious from the name, the pattern looks like a head with two shoulders. Essentially, when it is formed, the pattern signals that the security will probably move against the previous trend. The head–and–shoulders pattern has two versions – top and bottom. The head–and–shoulders top indicates that a security’s price is about to fall, once the pattern is complete. It is generally formed at the peak of an upward trend. The head–and–shoulders bottom, which is also known as inverse head and shoulders, indicates that a security’s price is set to rise. This usually forms at the time of a downward trend.
Description of the Pattern
The head–and–shoulders pattern is based on Dow Theory’s peak–and–trough analysis. The head and shoulders are represented by sets of peaks and troughs. Here, an upward trend resembles a period of successive rising peaks and troughs while a downward trend is a period of falling peaks and troughs. Where there is deterioration in the peaks and troughs, the head–and–shoulders pattern illustrates a weakening in the trend.
The two basic head-and-shoulder patterns are similar in that they have four main parts: two shoulders, a head and a neckline. The neckline is either a level of support or resistance. The patterns are confirmed when the neckline is broken, post the formation of the second shoulder.
- Head–and–Shoulders Top
When there is a head–and–shoulders top, it indicates to chart users that a security’s price is likely to move downwards, particularly after it breaks below the neckline of the pattern. Since this pattern forms mostly at the peaks of upward trends and the security declines after the pattern’s completion, it is commonly known as a trend–reversal pattern.
This pattern has four seminal steps for completion.
Step 1 comprises formation of the left shoulder, which occurs when the security reaches a new high and retraces to a new low.
Step 2 is the formation of the head that takes place when the security climbs a higher high and then retraces near the low formed in the left shoulder.
Step 3 is the formation of the right shoulder, which is a high that is below the high formed in the head. This is then followed by a retracement to the low of the left shoulder.
Step 4 is when the price drops below the neckline, which is a support line formed at the level of the lows at each of the three aforementioned retracements. It marks the completion of the pattern.
- Head–and–Shoulders Bottom (Inverse Head and Shoulders)
The head–and–shoulders bottom pattern is the binary opposite of the head–and–shoulders top as it indicates that the currency paid is about to move upwards.
There are four steps to this pattern too.
Step 1 is the formation of the left shoulder, which takes place when the price falls to a new low followed by a rise to a high.
Step 2 comprises formation of the head which occurs when the price moves to a low below the previously mentioned shoulder’s low and then returns to the previous high. This move back to the previous high makes the neckline.
Step 3 is the formation of the right shoulder, which is conventionally a sell–off that is less severe than the one from the previous head followed by a return to the neckline.
Step 4 sees the currency pair breaking above the neckline; when the price rises above the neckline created by the previous heads and shoulders, the pattern is complete.
Break at the Neckline and Move of Return
Formation of the neckline is critical in the head–and–shoulders pattern as the neckline is a support or resistance at the time of forming the pattern, apart from being the entry point at which the pattern confirms itself.
After the neckline is broken in Step 4, the currency pair should generally be towards a new direction. It is at this point when most traders following the pattern enter a position.
However, there is one scenario where this might not occur and the currency pair then returns to the previous trend. This is called a “throwback” move, and is characterised when the price breaks through the neckline, sets a new high or low (based on the pattern) and retreats to the neckline.
Conclusion
The head–and–shoulders pattern is effective for any time frame. Nevertheless, you should not use it in trading till you see the break of the neckline. While this method is not flawless and has a 1:3 reward-to-risk ratio, it is helpful when used correctly.
One fantastic thing with advanced trading softwares like NinjaTrader 8, is that it is possible to create indicators that automate the pattern recognition so you can focus on the trading decision. This is the case of the Chartist Indicator that we developped at NinjaAddons.com.
However, always keep in mind that It is namely you and not the indicator which decides when to trade in the market. Instead of robot trading, you need to take inputs from the pattern and exercise your better judgement to reap the maximum benefit.
Resource Links:
https://www.babypips.com/learn/forex/head–and–shoulders
https://www.tradingstrategyguides.com/head–and–shoulders–price–pattern–strategy/
https://www.investopedia.com/articles/technical/121201.asp
https://www.investopedia.com/terms/h/head–shoulders.asp
https://www.investopedia.com/university/charts/charts2.asp
https://www.investopedia.com/walkthrough/forex/beginner/level3/head–and–shoulders.aspx
Browse Categories
Featured Posts
 3 years ago
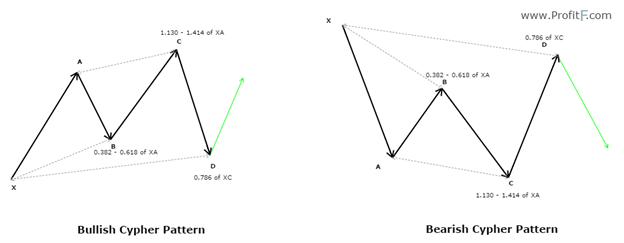
Cypher Pattern
 3 years ago
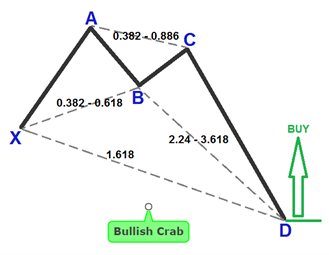
Crab Pattern
 3 years ago
Butterfly Pattern
 3 years ago
Bat Pattern
 3 years ago
ABCD Pattern
 3 years ago
The Rectangle Pattern
 3 years ago
Triangle Patterns
 3 years ago
Flag Pattern
 3 years ago
Double and Triple Pattern
 3 years ago
The Cup with Handle Pattern
3 years ago
The Head-and-Shoulders Pattern
Popular Posts
Cryptomining
3 years ago