
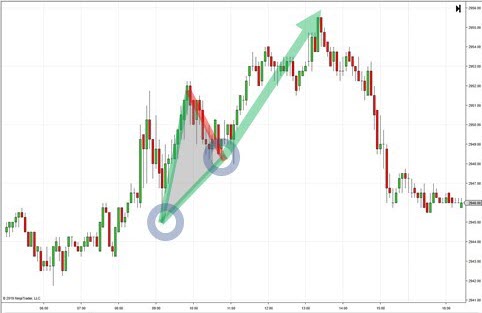
-
3 years ago
-

0
-

Triangle Patterns
Introduction
In trading, triangles are categorised under continuation patterns. They are basically horizontal trading patterns. At the beginning of its formation, the triangle is the widest. Then, as the market continues to trade in a sideways pattern, the point of the triangle is formed as the range of trading narrows. Basically, the triangle depicts losing interest in an issue, both from the buyer’s side and seller’s side. Here, the supply declines to meet the demand.
The lower line of the triangle or lower trendline depicts the trend of demand, which represents support on the chart. At this point, the buyers of the issue overtake the sellers, causing the stock’s price to rise. The top line of the triangle is the supply line and represents the overbought side of the market, when investors are reaping profits.
All triangles need to have a support line and a resistance line. To successfully draw resistance and support lines, they should have two price highs and two price lows, respectively. While the resistance line joins the two highs and extends to the right, the support line joins the two lows and also extends to the right.
There are primarily three kinds of triangles, namely, symmetric triangles, ascending triangles and descending triangles.
Symmetric Triangle
Symmetric triangles are essentially continuation patterns that take place in a market that is, for the most part, aimless in direction. Since the market seems to be static and listless, both the supply and demand lines appear to be the same. At this time of indecision, the highs and lows converge at the point of the triangle with no considerable volume.
Investors simply do not know which position to take with regard to the stock. When the investors decide on a particular stance, the line moves upwards or downwards with big volume. This comes as a contrast to the indecisive days or weeks before the breakout. Most of the times, the breakout occurs in the direction of the existing trend. However, if you are searching for an entry point following a symmetric triangle, it would be good to make a move at the breakout point.
A symmetric triangle occurs when the upward and downward movements of an asset’s price are confined to an increasingly smaller area. The price essentially has lower swing highs and lower swing lows.
Movement
The symmetric triangle indicates a period of consolidation in a trend followed by a resumption of the previous trend. It is formed by the joining of a descending resistance line and an ascending support line. These two trendlines need to have a similar slope and meet at a point called the apex. Typically, the stock price moves between these trendlines towards the apex, and then breaks out in the direction of the previous trend.
If preceded by a downward trend, the break occurs below the ascending support line and if preceded by an upward trend, the break is above the descending resistance line. This pattern may, however, not always lead to a continuation of the prior trend. When there is a break in the opposite direction of the prior trend, it signals the formation of a new trend.
Ascending Triangle
The ascending triangle is a bullish pattern that signals an upward movement of the price of the security upon completion. The pattern is formed by two trendlines, namely, a flat trendline that is a point of resistance and an ascending trendline which is a price support. The stock price moves between these trendlines until it ultimately breaks out to the upside. This pattern is conventionally preceded by an upward trend, which makes it a continuation pattern. However, it is found during a downtrend as well.
The pattern is formed by rising swing lows and swing highs that reach similar price levels. An ascending triangle can be drawn once two swing highs and two swing lows are joined with a trendline. Some traders to be on the safe side prefer waiting for three swing highs or lows before drawing the triangle.
Movement
The price trends to a high that faces resistance, which leads to a sell–off to a low. Then, there is another move higher, which tests the previous level of resistance. Upon failing to move past this level of resistance, the security is sold off again but to a higher low. This continues until the stock price rises above the level of resistance or the pattern fails.
The most important part of the ascending triangle is the ascending support line, which signals that sellers are beginning to leave the security. After the sellers exit the market, the buyers can cause the price to go past the resistance level and resume the upward trend.
The ascending triangle is complete once there is a breakout above the resistance level. However, the stock price can fall below the support line as well, thereby breaking the pattern. Hence, you need to be careful when entering the market before the breakout.
Descending Triangle
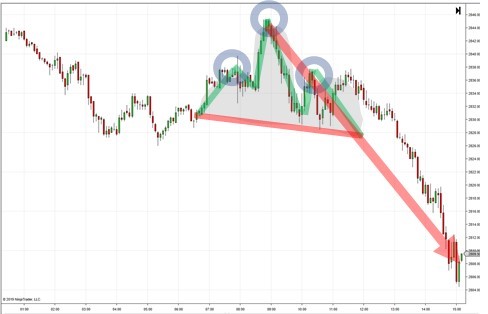
The descending triangle is the binary opposite of the ascending triangle. It is a bearish pattern that suggests that the stock price will move downward upon completion. The descending triangle has a flat support line and resistance line that slopes downwards. The support line is flat or horizontal since the price lows reach similar levels.
Since it is preceded by a downward trendline, the descending triangle is conventionally considered to be a continuation pattern. However, it can be found in an uptrend as well. This pattern can be formed as soon as there are two swing highs and two swing lows in the stock price. You may then want to extend the lines to the right to help predict future price action.
In reality, if there are more than two points to connect, the trendline may not perfectly connect the highs and lows. This is alright, given that the trendlines are drawn to fit the price action in the best possible manner.
Movement
The descending triangle first marks a fall to a low before finding a level of support, which pushes the price to a high. The next move tests the previous support level, driving the stock price higher but this time to a lower level than the previous higher move. This is repeated until the price is unable to hold the support level and declines below it, thereby resuming the downtrend.
This pattern indicates that buyers are trying to pull up the stock price but keep facing resistance. After several attempts to make the stock move higher, the buyers are overtaken by the sellers, which makes the price move lower.
Conclusion
Triangles can occur in any time frame, ranging from tick charts to daily, weekly or monthly charts. Hence, traders and investors can look for triangle formations of varying degrees on all time frames. For instance, you could find a triangle on the 15–minute time frame, which is inside a larger triangle found on daily chart data. It is possible to make a wise investment if you draw the multiple patterns on the chart. You can then better identify the probable areas of strong support and resistance.
Triangles are easy to identify and greatly help traders to study the market better. These patterns provide good risk–reward opportunities. Thanks to triangles, investors can quickly know when a big move is approaching, along with the profit objective and the amount that is at risk.
Moreover, triangles indicate a reduction in volatility, which could eventually increase again. This provides an analytical insight into the current scenario, and what kind of conditions may be forthcoming. The triangle pattern also essentially provides trading opportunities, both as it is forming and once it completes. Hence, it is an integral part of investment trading.
Reference Links:
https://www.investopedia.com/articles/technical/03/091003.asp
https://www.investopedia.com/articles/trading/11/continuation–patterns–triangles.asp
https://www.investopedia.com/university/charts/charts5.asp
https://www.thebalance.com/triangle–chart–patterns–and–day–trading–strategies–4111224
Browse Categories
Featured Posts
 3 years ago
Cypher Pattern
 3 years ago
Crab Pattern
 3 years ago
Butterfly Pattern
 3 years ago
Bat Pattern
 3 years ago
ABCD Pattern
 3 years ago
The Rectangle Pattern
 3 years ago
Triangle Patterns
 3 years ago
Flag Pattern
 3 years ago
Double and Triple Pattern
 3 years ago
The Cup with Handle Pattern
 3 years ago
The Head-and-Shoulders Pattern
Popular Posts
Cryptomining
3 years ago