
-
3 years ago
-

0
-

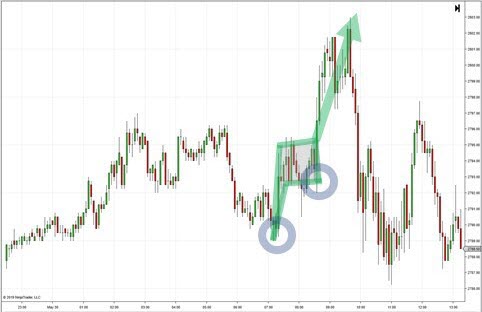
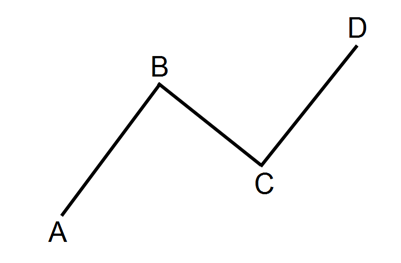
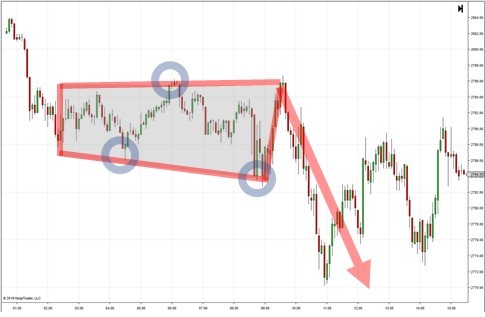
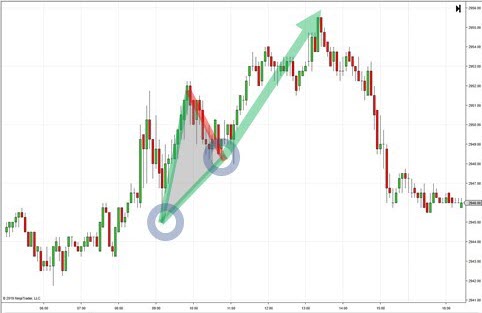
Flag Pattern
Introduction Flags are chart patterns formed by price action, which is shown within a small rectangle or a parallelogram. These are typically small, indicating comparatively small risk and quick profits. When the market consolidates in a narrow range after a sharp move, a flag chart pattern is formed. A flag is usually preceded by a sharp rise …

-
3 years ago
-
0
-
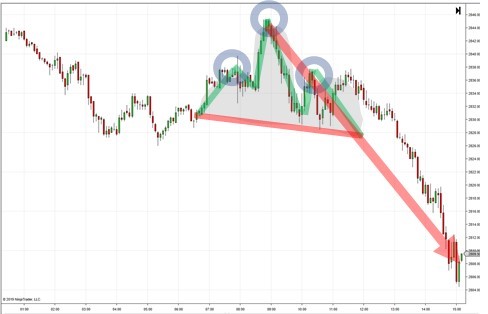
Double and Triple Pattern
Introduction Double and triple top/bottom patterns are generally used to get a thorough idea on how the current stock trend may shift over a particular course of time. The top formations occur in the uptrend whereas their counterparts take place in case of downtrend. However, identifying a particular money-making pattern through stock charts often can …
Browse Categories
Featured Posts
 3 years ago
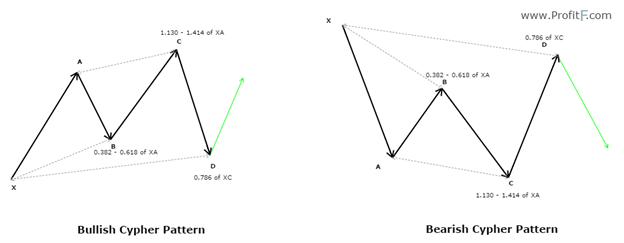
Cypher Pattern
 3 years ago
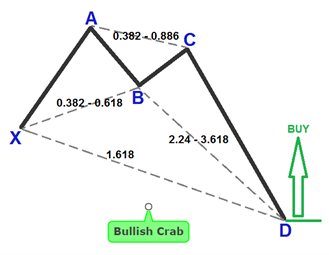
Crab Pattern
 3 years ago
Butterfly Pattern
 3 years ago
Bat Pattern
 3 years ago
ABCD Pattern
 3 years ago
The Rectangle Pattern
 3 years ago
Triangle Patterns
3 years ago
Flag Pattern
3 years ago
Double and Triple Pattern
 3 years ago
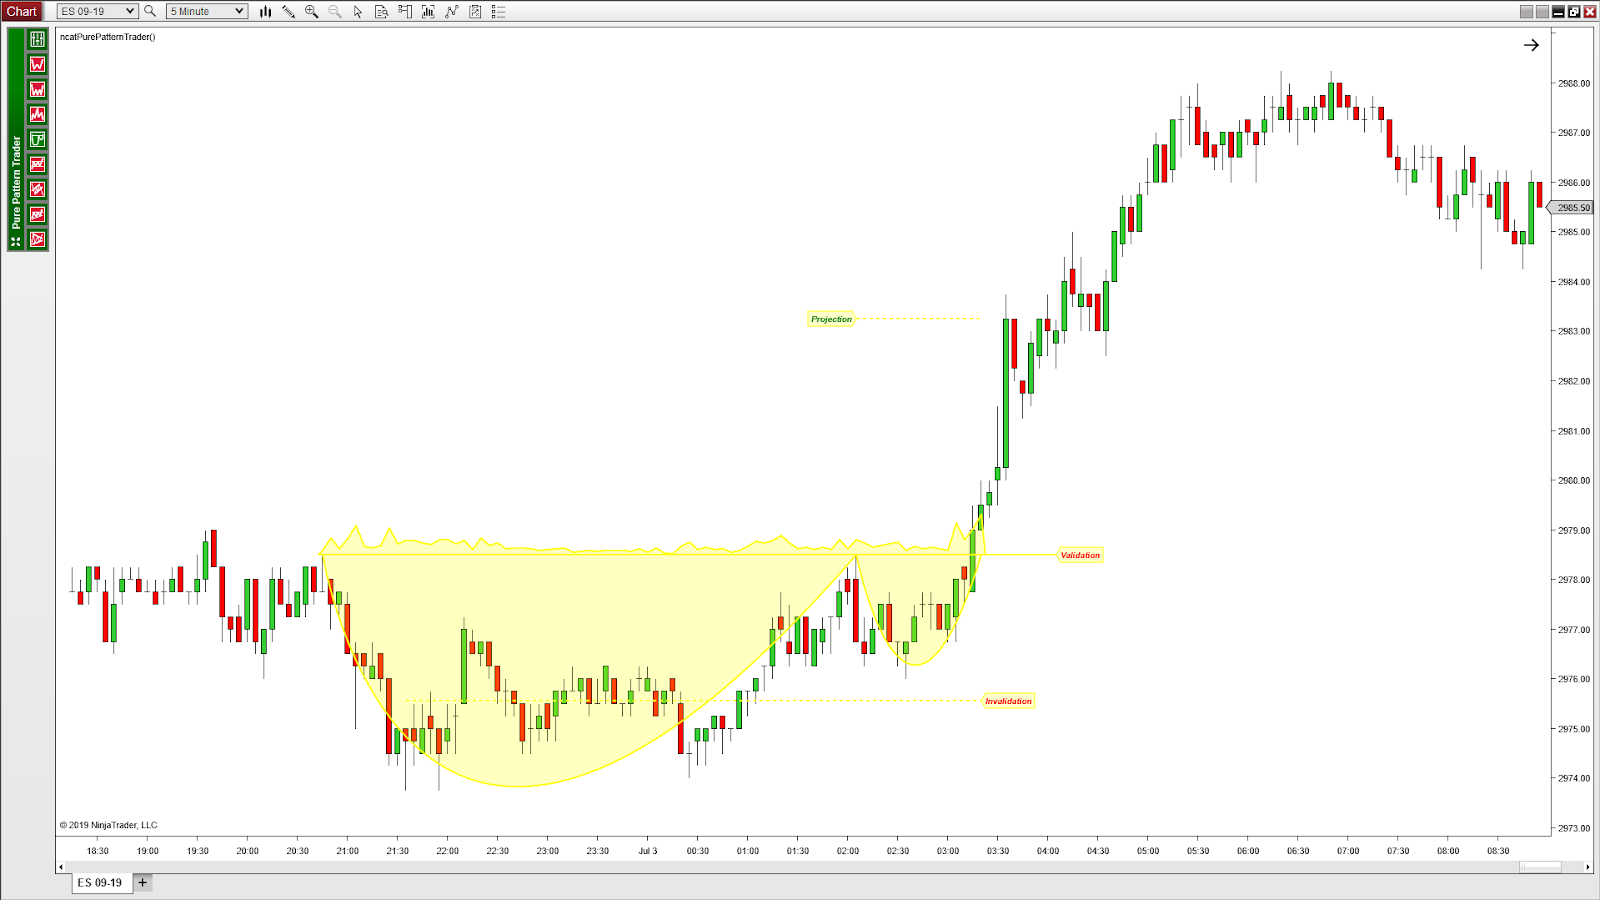
The Cup with Handle Pattern
 3 years ago
The Head-and-Shoulders Pattern
Popular Posts
Cryptomining
3 years ago