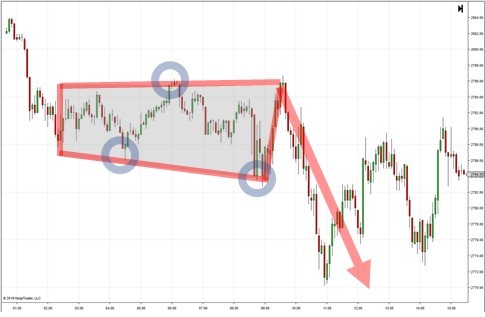
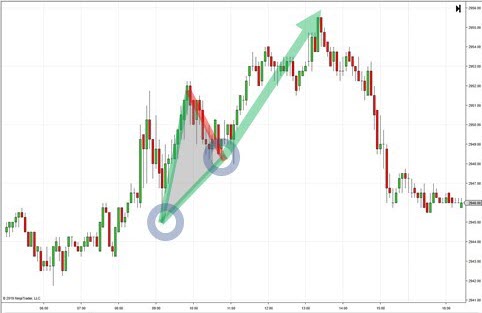
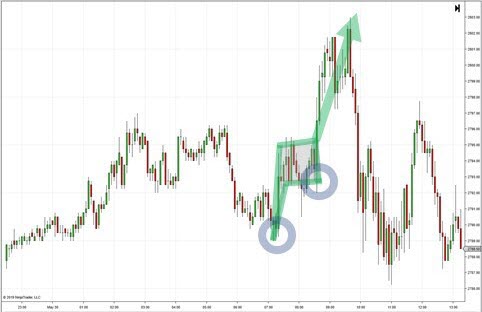
Introduction In trading, the Bat pattern is a 5-point retracement structure. It was developed by Scott Carney in 2001 in his book The Harmonic Trader. This pattern has particular Fibonacci measurements for each point within its structure. It is held to be one of the more accurate patterns and has a greater success rate than …
Monthly Archives: June 2021
ABCD Pattern
Introduction Among harmonic patterns, the simplest is the ABCD pattern. It consists of two equivalent price legs and is not difficult to identify on charts. This is because it has a structure with specific Fibonacci measurements of each point. This factor removes chances of a flexible interpretation. The ABCD is a reversal pattern that indicates when the …
The Rectangle Pattern
Introduction The rectangle is a classical trading pattern marked by horizontal lines showing significant support and resistance. Support refers to any price point below the current market price where buying emerges to create, at least temporarily, a pause in a downtrend. When the price is above the current market price where selling causes, at least temporarily, a pause in an uptrend, it shows resistance. This …
Triangle Patterns
Introduction In trading, triangles are categorised under continuation patterns. They are basically horizontal trading patterns. At the beginning of its formation, the triangle is the widest. Then, as the market continues to trade in a sideways pattern, the point of the triangle is formed as the range of trading narrows. Basically, the triangle depicts losing interest …
Flag Pattern
Introduction Flags are chart patterns formed by price action, which is shown within a small rectangle or a parallelogram. These are typically small, indicating comparatively small risk and quick profits. When the market consolidates in a narrow range after a sharp move, a flag chart pattern is formed. A flag is usually preceded by a sharp rise …
Double and Triple Pattern
Introduction Double and triple top/bottom patterns are generally used to get a thorough idea on how the current stock trend may shift over a particular course of time. The top formations occur in the uptrend whereas their counterparts take place in case of downtrend. However, identifying a particular money-making pattern through stock charts often can …
The Cup with Handle Pattern
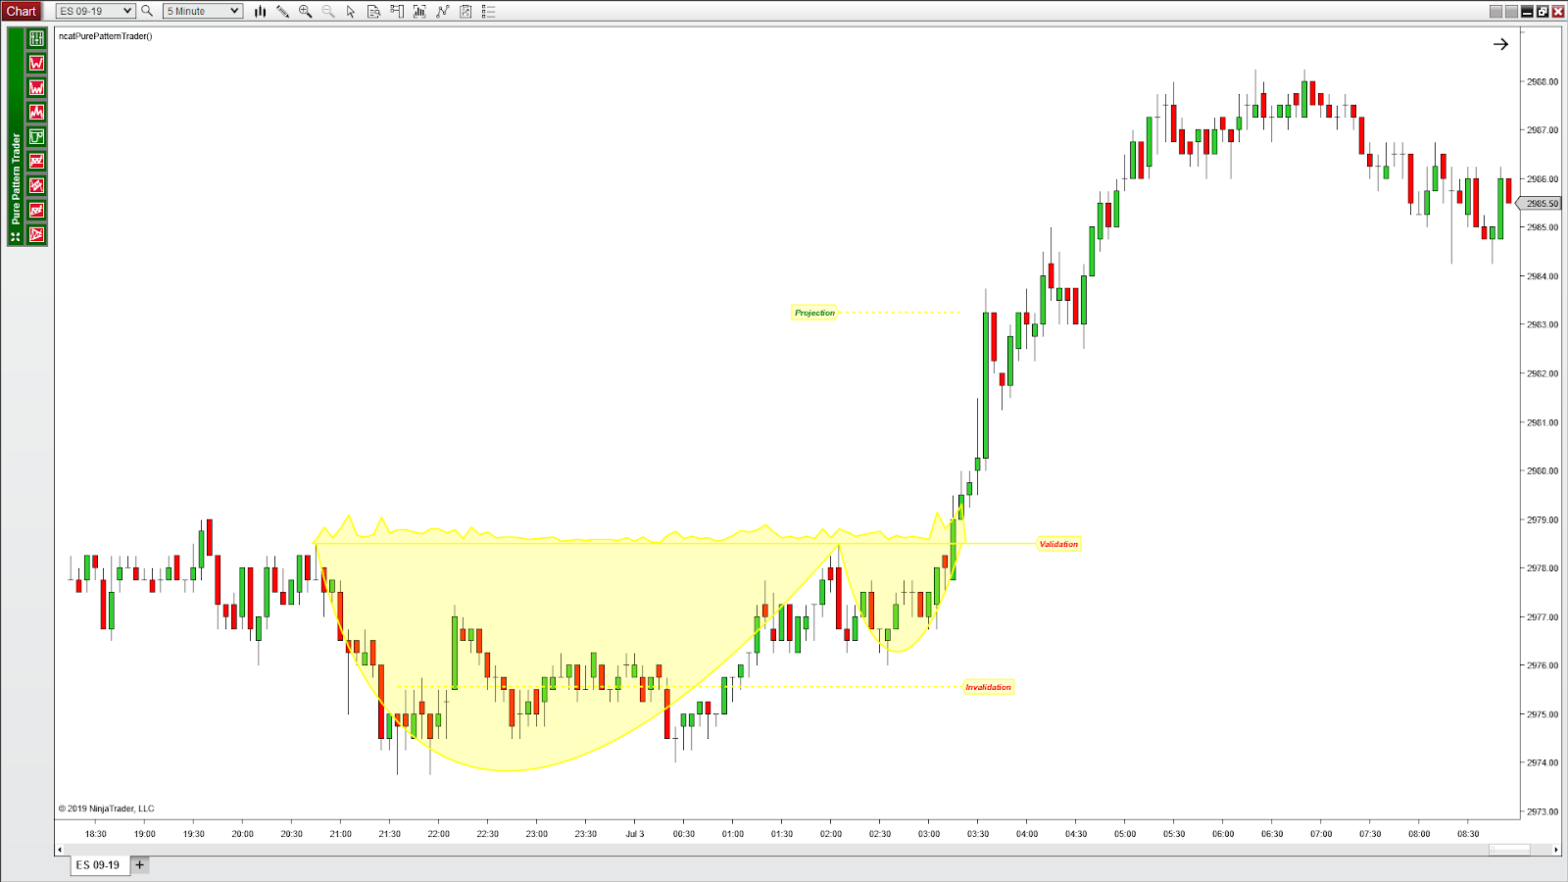
Introduction The cup with handle refers to a bullish continuation pattern where the upward trend has paused and declined, but will rise upon completion of the pattern. It can range from several months to a year, but its general form remains the same. On bar charts, a cup and handle pattern bears a resemblance to its namesake, that is, …


